Dashboards
Sales Analytics
The look and feel of the dashboard(s) will have to be iterated.
Requirements:
-
Dimensions and filters:
- Customer, Channel, Subchannel, Chain, Customer Entity
- Article
- Brand
- Main Category, Sub Category
- Model
- Supplier
-
Axis:
- x: Evolution over time
- y: select
- quantity
- sales (eur)
- margin
-
Data
- Include historic data
- Filter for date range (including calendar weeks)
-
Features:
- Export to Excel for further analysis
Price Lists
NOTE:
- cf Video 16. Feb 2023, 25:00
- cf Price list
data\Prijslijst 2023 - Babykid Q2 NIET VERSTUREN.xlsx
A pricelist contains two parts:
-
details shared with the customer
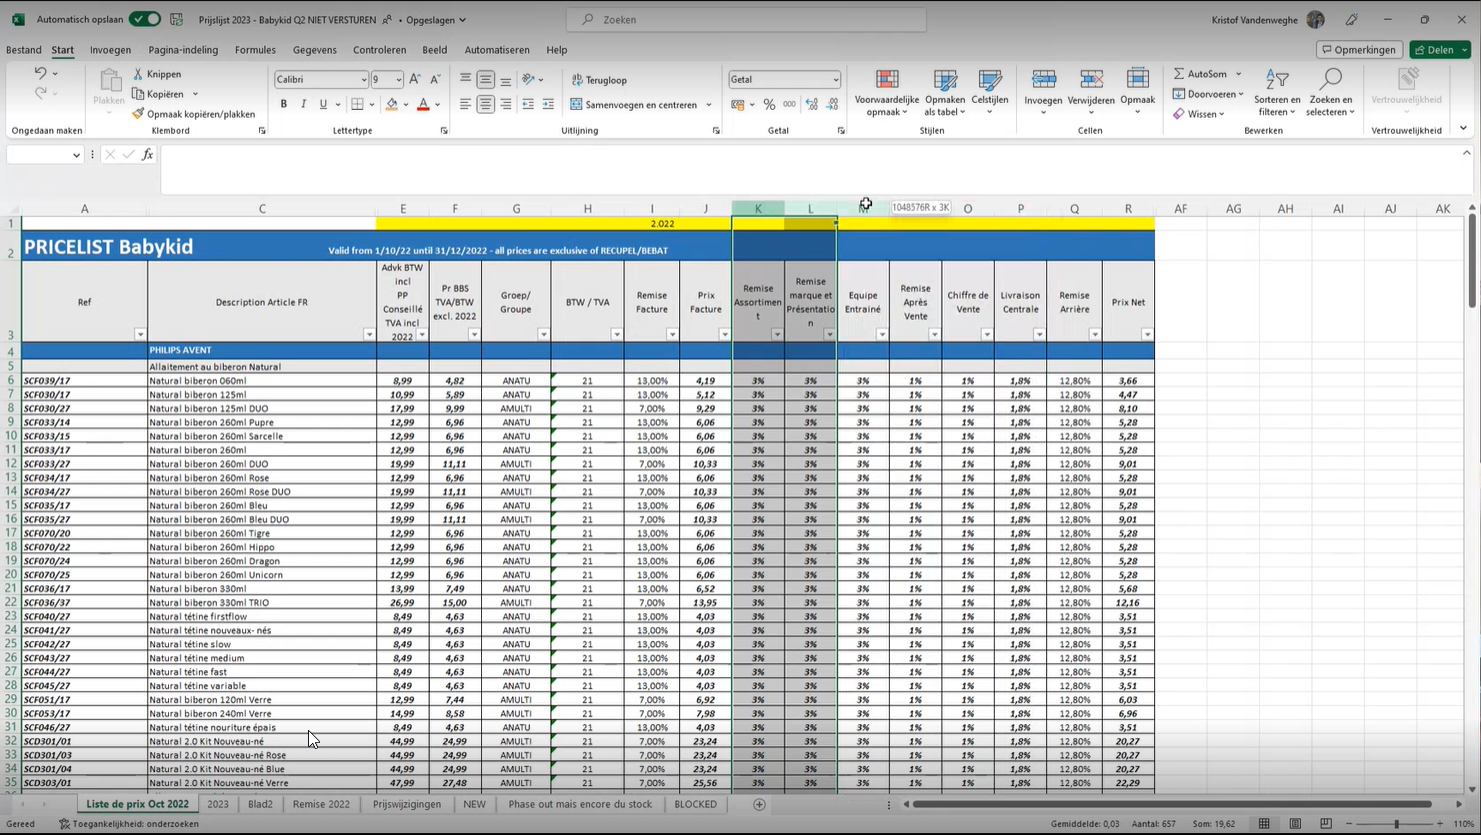
- E: recommended sales price
- G: discount group- I: rebate on invoice price
- J: price on invoice
- L-P = Q: rebate "en arrière": these are currently not managed in BC, but they should
-
Kristof's calculations, which are private. They are used to simulate/play with the margins for next year, or for the next price raise.
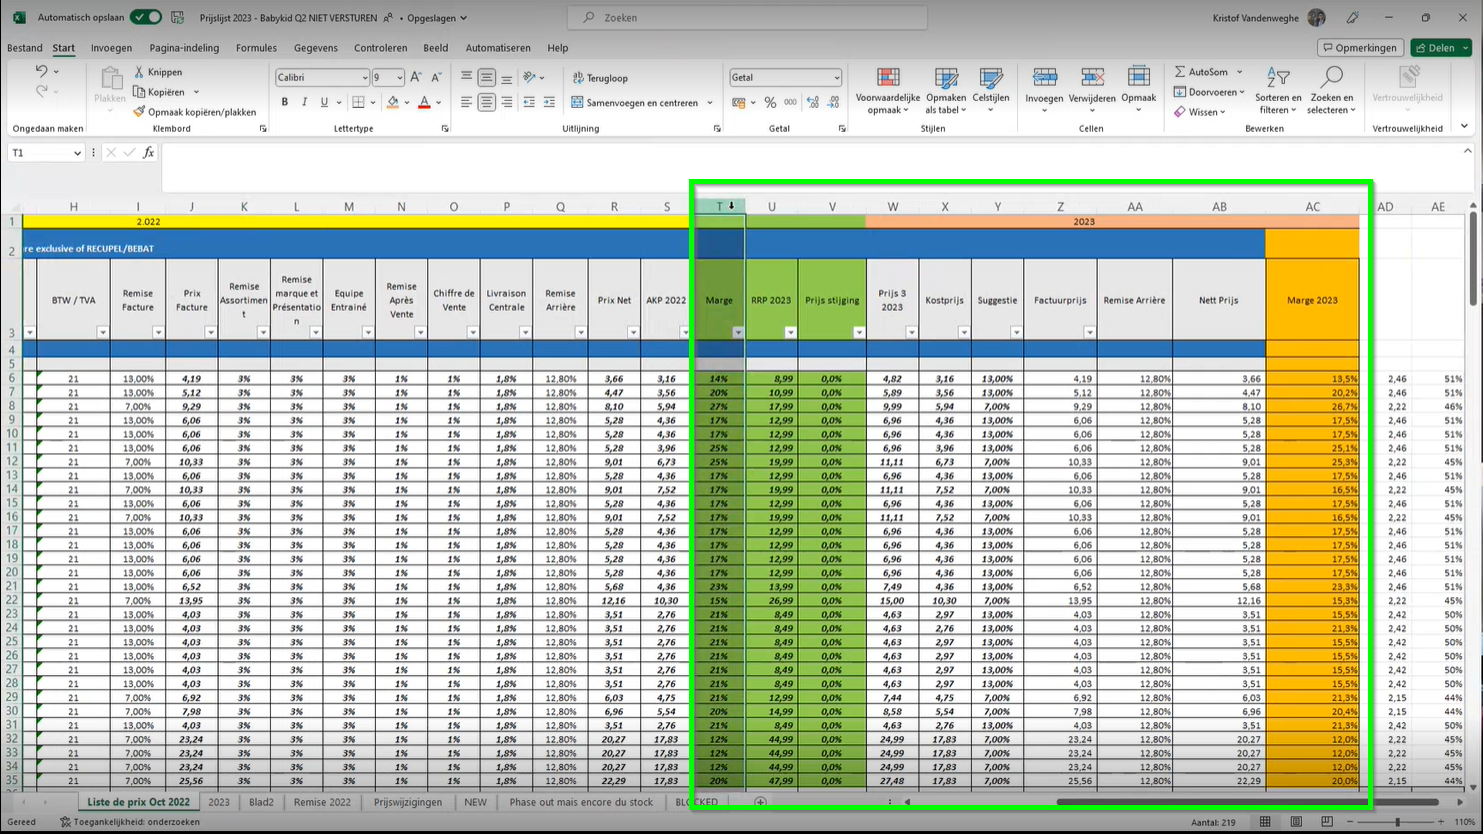
- here, the only thing missing is the quantities orderded by the client
We need two artefacts:
- a report to be sent to the client -> ideally from Power BI, with the following parameters/filters:
- customer discount group
- price list group
-
options:
- all articles bought
- all articles available to them
-
a facility to export the data into Excel, so Kristof can simulate prices
Data needed:
-
customers
- meta data
- discount group
-
sales data
- quantities per SKU
-
price lists (discount groups)
-
rebates en arrière
Substitution Analysis
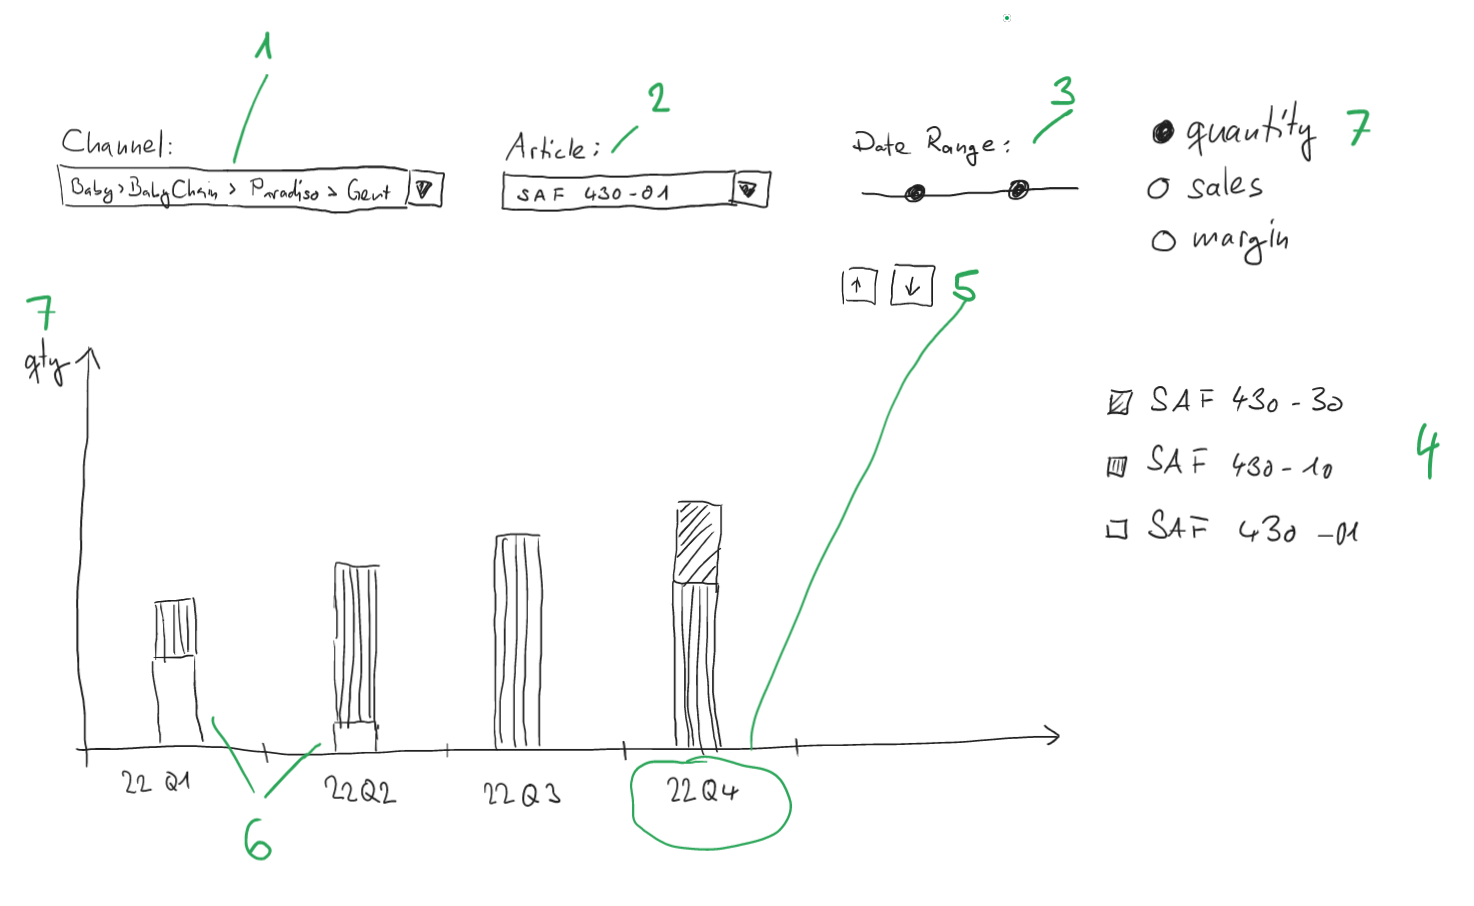
- Select channel on all 4 levels, i.e.
- main channel
- subchannel
- chain
-
customer entity
-
Select article substitution group by selecting most recent article
-
select date range by select start date and end date. Default for end date is today.
-
Once article is selected, all substitution articles are displayed in the legend
-
analyse by different date buckets (year, quarter, month, week)
-
analyse when one product is phased out (SAF 430-01) and replaced by another (SAF 430-10)
-
display analysis for quantity (units sold), sales (euro amount) and margin (euro net margin generated)
Recap Report
Purchase invoice lines / sales order invoice lines
QUESTION: do we have a recap report for Recupel & Bebat (BE Batteries)
Cf. 16:25