Reports
NOTE: groei means growth
Dashboard
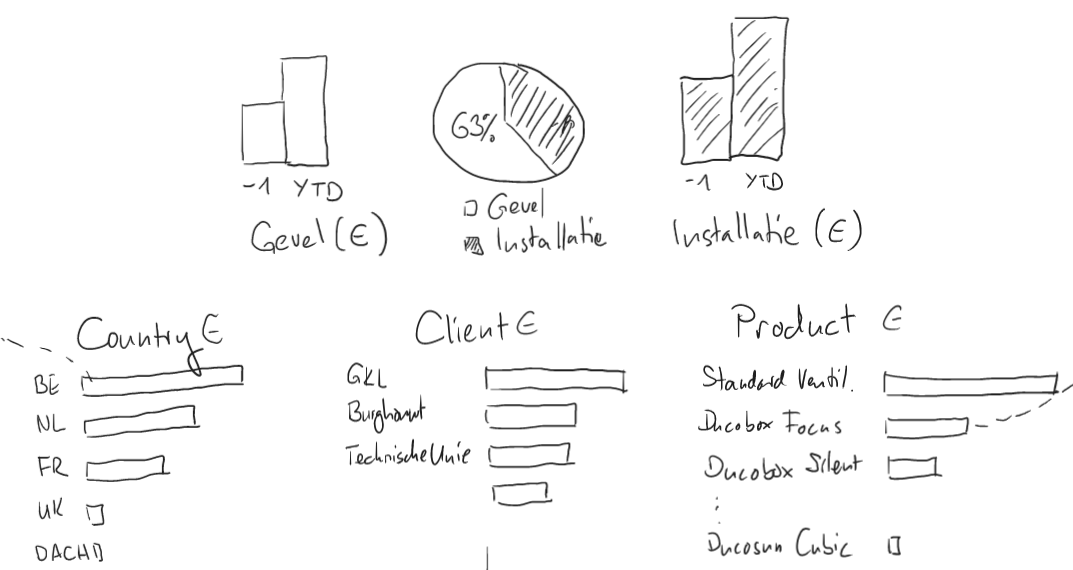
IDEA: we can have additional details with hover
QUESTION: How should we handle different country buckets for two areas?
ANSWER: either just countries (no buckets), or column for buckets. Buckets will change sometimes.
Country Detail
-
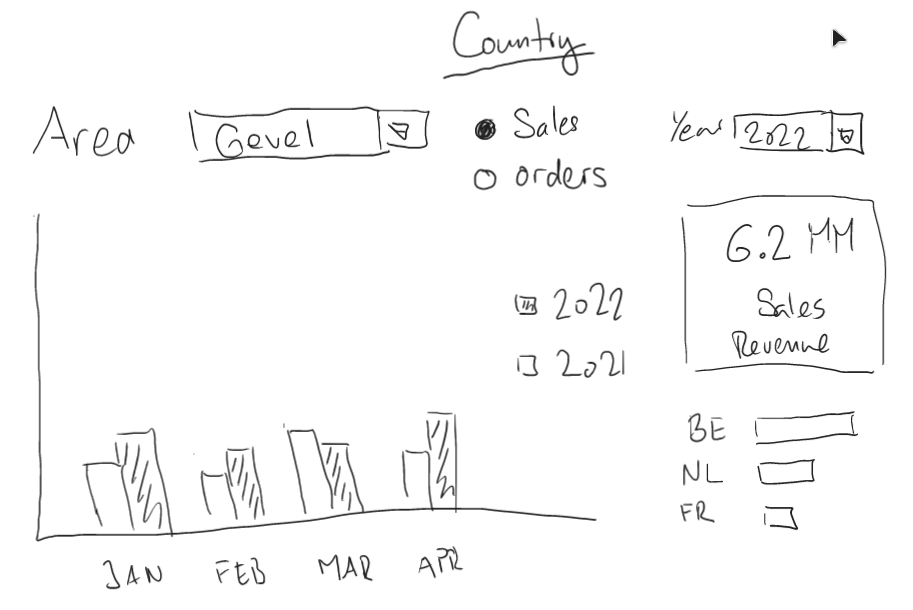
Select the area (gevel or installatie)
-
Select the variable (sales revenue or number of orders)
-
Select the year
-
Filter the country if desired
-
Display the variable, vs T-1
-
Fully interactive (select any element, the others adjust)
Client Detail
-
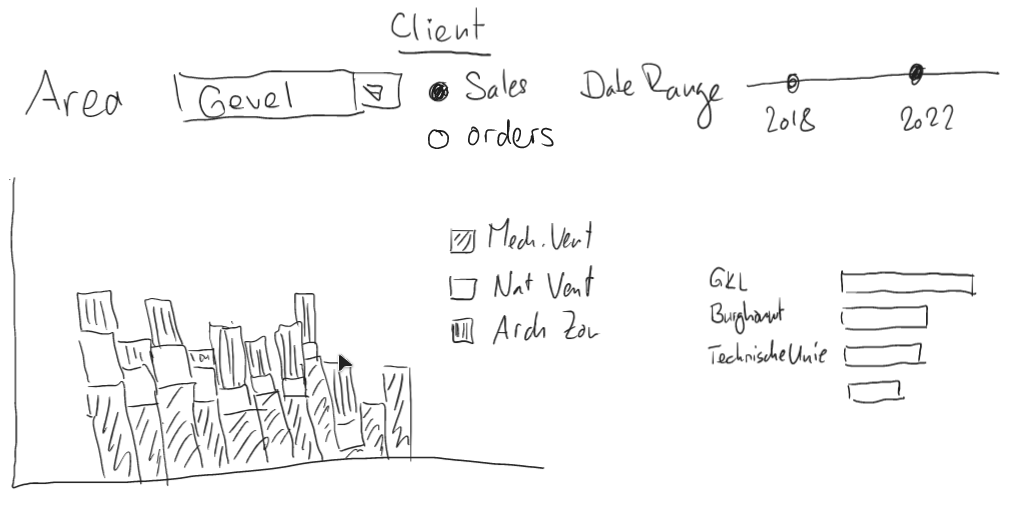
Select the area (gevel or installatie)
-
Select the variable (sales revenue or number of orders)
-
Select the date range
-
Filter the client if desired
-
Display the variable, over time, by product group
-
Fully interactive (select any element, the others adjust)
Product Detail
-
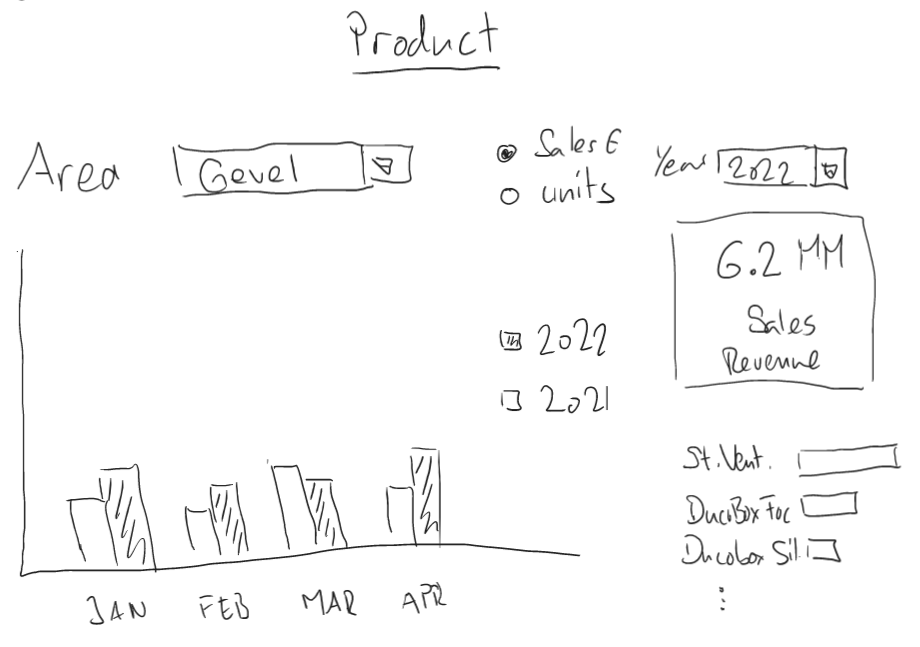
Select the area (gevel or installatie)
-
Select the variable (sales revenue or units sold)
-
Select the year
-
Filter the product if desired
-
Display the variable, vs T-1
-
Fully interactive (select any element, the others adjust)
Targets
-
Select sales team / region
-
Select area
-
Select time period
-
Display sales vs target