DAX Open Orders
Origin
This example comes from #umbr . It was handled in ticket #3553.
You will find the underlying pbix here: https://github.com/pwrp/umbr/blob/main/code/power%20bi/Dataset/umbr_open_orders_stylized.pbix
Summary
When we have multiple dates, DAX gets hard very quickly.
Problem
We have a table with orders. Each order has a an OrderDate and a ShipmentDate.
We want to calculate the amount of open orders as of today, as of a year ago, 2 years ago, etc.
An additional complication comes from the fact that the financial year of the company is not the calendar year. The financial year starts on October 1st.
Finally, the solution must be filterable by all dimensions of the model.
Example
Assume we have the following orders:
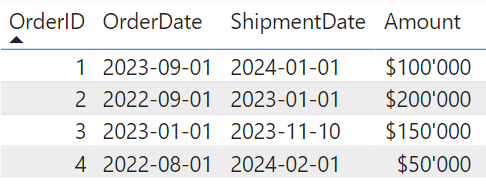
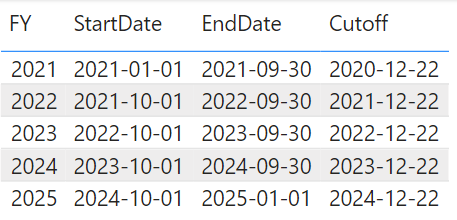
Assume further, we are on 2023-12-22.
The financial years and the cutoff dates are:
Solution
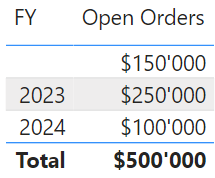
The Open Orders should then be:
Or, visually:

Note that:
- The horizontal years bar points to the FY.
- The vertical years columns refer to the calendar year.
- The small blue triangles refer to the cutoff dates.
- Order 3 is not counted in the FY 2023, because it was shipped before the cutoff date.
- Order 4 is counted in the FY 2023, even though it still not shipped today.
Solution
The solution consists of the following steps:
-
create a calculated table
DimFiscalYear -
create a calculated column
Open in FYinFactInvoiceLine -
create a relationship between
DimFiscalYearandFactInvoiceLine
DimFiscalYear
DimFiscalYear =
//VAR _today = DATE(2023, 9, 21)
VAR _today = TODAY()

VAR _cor = LOOKUPVALUE(DimCalendar[FY], DimCalendar[Date], _today) - YEAR(_today)

VAR _dt = ADDCOLUMNS(
 SUMMARIZECOLUMNS(DimCalendar[FY],
                 "StartDate", MIN(DimCalendar[Date]),
                 "EndDate", MAX(DimCalendar[Date])

),
   "Today", _today,
   "Cutoff", DATE([FY] - _cor, MONTH(_today), DAY(_today))
)

RETURN _dt
Open in FY
Open in FY =

VAR _od = FactInvoiceLine[OrderDate]
VAR _sd = FactInvoiceLine[ShipmentDate]

VAR _fy = CALCULATE(MIN(DimFiscalYear[FY]), FILTER(DimFiscalYear, _od <= DimFiscalYear[Cutoff]) , FILTER(DimFiscalYear, _sd >= DimFiscalYear[Cutoff]))
RETURN _fy
Variations
-
Instead of creating a separate FY table, we could have linked the new calculated column to the DimCalendar table. Then, we would have to take the cutoff date instead of the FY.
-
We could have used a measure instead of a calculated column. The measure would have to find the last cutoff date of the context.
General Take-Aways
-
A measure cannot take inputs. And it cannot return a table. It can only return a scalar value. This makes measure difficult for multi-year logic.
-
ALWAYS use a stylized example to analyse a hard problem. This will make sure you understand the problem and the solution.
-
Make sure you understand the problem BEFORE you play around with DAX.