Data Engineer Case Interview - Interviewer Background
Case
Mayfair Real Estate is a real estate agent with 10 employees. They sell around 120 houses per year on behalf of their clients.
The business process of Mayfair is like this:
-
For a new property to be sold, the agent puts pictures and information of the property into RealSoft, their real estate ERP.
-
RealSoft has a feature to list the property on Mayfair website at the click of a button.
-
The agent then plans one or more paid facebook campaigns, in which he adds nice pictures and a link to the web site listing.
The manager of Mayfair would like to analyse how impactful the facebook campaigns are. The success of a campaign is measured by the number of site views of a property on Mayfair website.
Guidance
-
Be nice to the candidate.
-
The setting is artificial. Don't overdo it with the role play. But also make it clear that the candidate is the driver of the process.
-
1 hour is short. Don't spend too much time on a single topic. If the candidate gets stuck, help him and move on.
Pipelines
flowchart LR

    RS[fa:fa-database RealSoft<br>ERP]
    FB[fa:fa-facebook Facebook<br>API]
    GA[fa:fa-google Google<br>Analytics]
    DS((fa:fa-star Dataset))
    R(fa:fa-pie-chart Report)


    RS-->DS
    FB-->DS
    GA-->DS
    DS-->R;

    style RS fill: #33cccc,color:black
    style FB fill: blue,color:white
    style GA fill: green,color:white
    style DS fill:#FFD700,color:#fff
    style R fill:#FFD700,color:#fff
ADM (Semantic Data Model)
This is called "Constellation Diagram" in the DAMA-DMBOK.
See https://www.amazon.com/DAMA-DMBOK-Data-Management-Body-Knowledge/dp/1634622340 for details.
erDiagram

    FactViews {
        int Biews
    }

    FactCampaign {
        ccy Budget
    }


    DimCalendar {
        date Date
        etc etc
    }

    DimProperty {
        txt Type
        txt Segment
        txt City
        txt Agent
    }


    DimCalendar ||--o{ FactViews: refs
    DimCalendar ||--o{ FactCampaign: refs
    DimProperty ||--o{ FactViews: refs
    DimProperty ||--o{ FactCampaign: refs
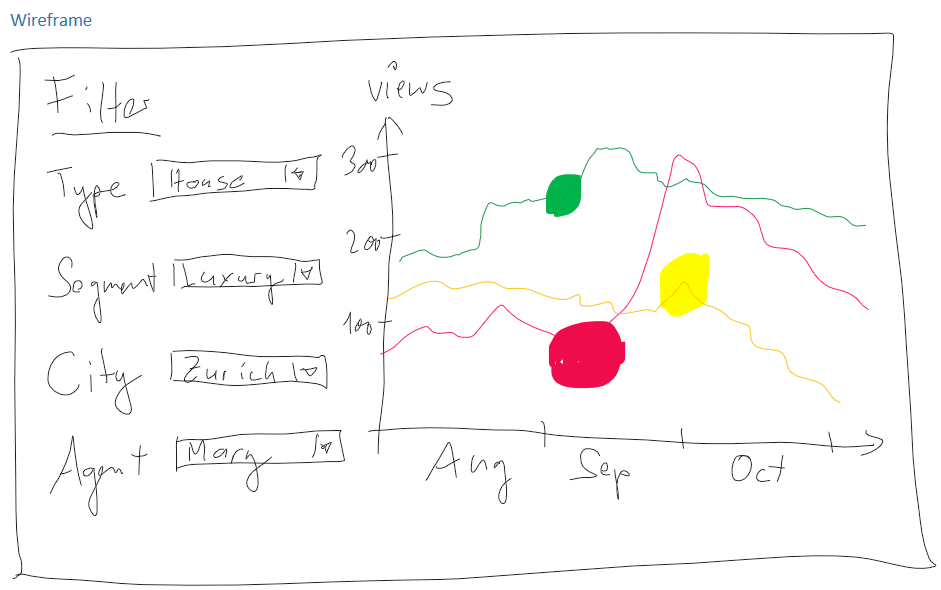
Wireframe
This is probably the worst possible wireframe. But it's our wireframe. :-)