DAX Last Balance
Problem Statement
Flow variables are variables that represent the flow of something over a given period of time. In our case, the transaction represents the decrease or increase of the amount assigned to an account code over a time period, such as within a month. Transactions involve the movement of funds into or out of a bank account, and they occur over a certain time period.
Stock variables are variables that represent the total amount of something at a given point in time. In our example, the Balance measure is a state variable, because it describes the current condition on our account. It's a snapshot of the funds in the account at a particular moment. Stock variables are typically measured at a specific point in time, such as at the end of a month or a year.
Suppose that the stock variable values are stored in a Fact Table.
Suppose further that the stock variable is discriminated by one or more Dims, e.g. DimCashAccount.
Further, suppose that the stock variable is measured at irregular intervals. For example, typically we get one Cash Balance per month. But sometimes we get more than one per months. And sometimes, some months are missing.
Finally, suppose that the previous irregularities might be different from one dimension value to the other. For example, for cash account A we get a balance on 31. Jan 2023 and 31 March 2023, whereas for cash account B we get a balance on 1. Jan 2023 and on 28. February 2023.
Now, we would like to calculate our total cash balance for any point in time.
Implicitly, we assume that "no news = no change". So, whenever we don't have new values of our stock variable, then the last value is still valid. Here, it is important to understand that this "fill-down" characteristic is per dimension.
We would now like a DAX measure that calculates, for any point in time, the sum of the stock variable's level.
Real World Example
You can see this in action for #lb, in Dataset #lb.pbix.
Example
We are looking at our standard G/L data model, with cash balances.
Let's say our (simplified) fact table looks like this:
| AccountCode | Date | Amount |
|---|---|---|
| 100000 | 2023-01-31 | 100 |
| 100000 | 2023-03-31 | 150 |
| 100100 | 2023-01-01 | 420 |
| 100100 | 2023-01-31 | 430 |
| 100100 | 2023-02-28 | 375 |
In an unpivoted view, we have:
| Date | 1000000 | 100100 |
|---|---|---|
| 2023-01-01 | 420 | |
| 2023-01-31 | 100 | 430 |
| 2023-02-28 | 375 | |
| 2023-03-31 | 150 |
If we fill this down, by account, we get:
| Date | 1000000 | 100100 |
|---|---|---|
| 2023-01-01 | 0 | 420 |
| 2023-01-31 | 100 | 430 |
| 2023-02-28 | 100 | 375 |
| 2023-03-31 | 150 | 375 |
We can then easily calculate the total cash balance for any date by summing over the accounts:
| Date | 1000000 | 100100 | Total |
|---|---|---|---|
| 2023-01-01 | 0 | 420 | 420 |
| 2023-01-31 | 100 | 430 | 530 |
| 2023-02-28 | 100 | 375 | 475 |
| 2023-03-31 | 150 | 375 | 525 |
Requirements
- The DAX measure should work for arbitrary filter contexts (month, quarter, year, etc)
- The DAX measure should work for buckets in which we have no data
- The DAX measure should be extensible in case there are more dimensions (e.g. an account type) for which we want to filter
ADM (Semantic Model, Star Schema)
While the solution would work with a single fact table, we'll keep it close to real-world scenarios. Let's assume we have a separate DimCalendar:
erDiagram
    FactAmount {
        code AccountCode
        eur Amount
    }

    DimCalendar {
        date Date
        int Year
        int Month
        str YearMonthNumber
        etc etc
    }

    DimAccount {
        int AccountCode "100000"
        txt AccountName
        int AccountMainGroupCode "10"
        txt AccountMainGroupName "Liquidity"
        code AccountCategory "I or B for IncomeStatement or BalanceSheet"
    }


    DimCalendar ||--o{ FactAmount: refs
    DimAccount ||--o{ FactAmount: refs
Solution
We get to the solution in a few steps:
-
Index: we add an index column in Power Query to order our transactions
-
Transaction: this is a calculated column that shows the change of amounts between months (increase or decrease), per account
-
Balance: this measure sums up the transactions between periods
Transaction
Transaction =

    //Adds a calculated column that calculates the transactions (flow variable) from the balances (stock variable)
    VAR _cur_idx = 'FactAmount'[Index]
    VAR _balances_for_account = CALCULATETABLE ( 'FactAmount', ALLEXCEPT ( 'FactAmount', 'FactAmount'[Account] ) )
    VAR _before_date = FILTER ( _balances_for_account, [Index] < _cur_idx )
    VAR _last_balance_tbl = TOPN ( 1, _before_date, [Index] )
    VAR _last_balance = SELECTCOLUMNS ( _last_balance_tbl, "@Balance", [Amount] )
    VAR _transaction = FactAmount[Amount] - _last_balance

    VAR _trx = IF(FactAmount[AccountType] = "T", FactAmount[Amount], _transaction)

RETURN
    _trx
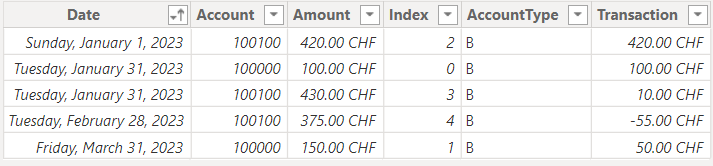
With this column we get the increase or decrease that happened between two transactions per AccountCode:
| AccountCode | Date | Amount | Transaction |
|---|---|---|---|
| 100100 | 2023-01 | 420 | 420 |
| 100100 | 2023-01 | 430 | 10 |
| 100100 | 2023-02 | 375 | -55 |
| AccountCode | Date | Amount | Transaction |
|---|---|---|---|
| 100000 | 2023-01 | 100 | 100 |
| 100000 | 2023-03 | 150 | 50 |
Nice!
Balance
Balance =
    //calculates the balance as the sum of all previous (calculated) transactions, by account
    var _max_date = LASTDATE(DimCalendar[Date])
    var _amnt = CALCULATE( SUM(FactAmount[Transaction]), REMOVEFILTERS(DimCalendar), KEEPFILTERS(DimCalendar[Date] <= _max_date))
    return _amnt
The trick lies in the combination of REMOVEFILTERS and KEEPFILTERS. So, when the filter context is, say, February 2023, the filter context is changed to any date before the last date of February.
In a nutshell, before we derived the transactions (flow variable) from the balance. Now, we calculate again the balance (state variable) from the derived transactions.
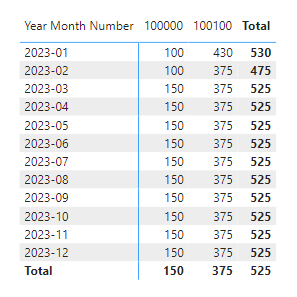
For our example, this yields:
| Date | 100000 | 100100 | Balance |
|---|---|---|---|
| 2023-01 | 100 | 430 | 530 |
| 2023-02 | 100 | 375 | 475 |
| 2023-03 | 150 | 375 | 525 |
| 2023-04 | 150 | 375 | 525 |
Aggregations
As handling flow variables is much easier than handling state variables, the new measure for balance can be summed up.
Filtering
So far, we haven't filtered for any account. And in the example of the G/L ADM, we have lots of accounts, whereby only few are cash accounts.
Therefore, we typically need to filter.
We do this by using calculate on the Balance measure.
For example, we can create a Cash measure like this:
We could easily add more filters if needed, e.g.