Solution Overview
This document describes the latest solution, called Phase 3.
Background
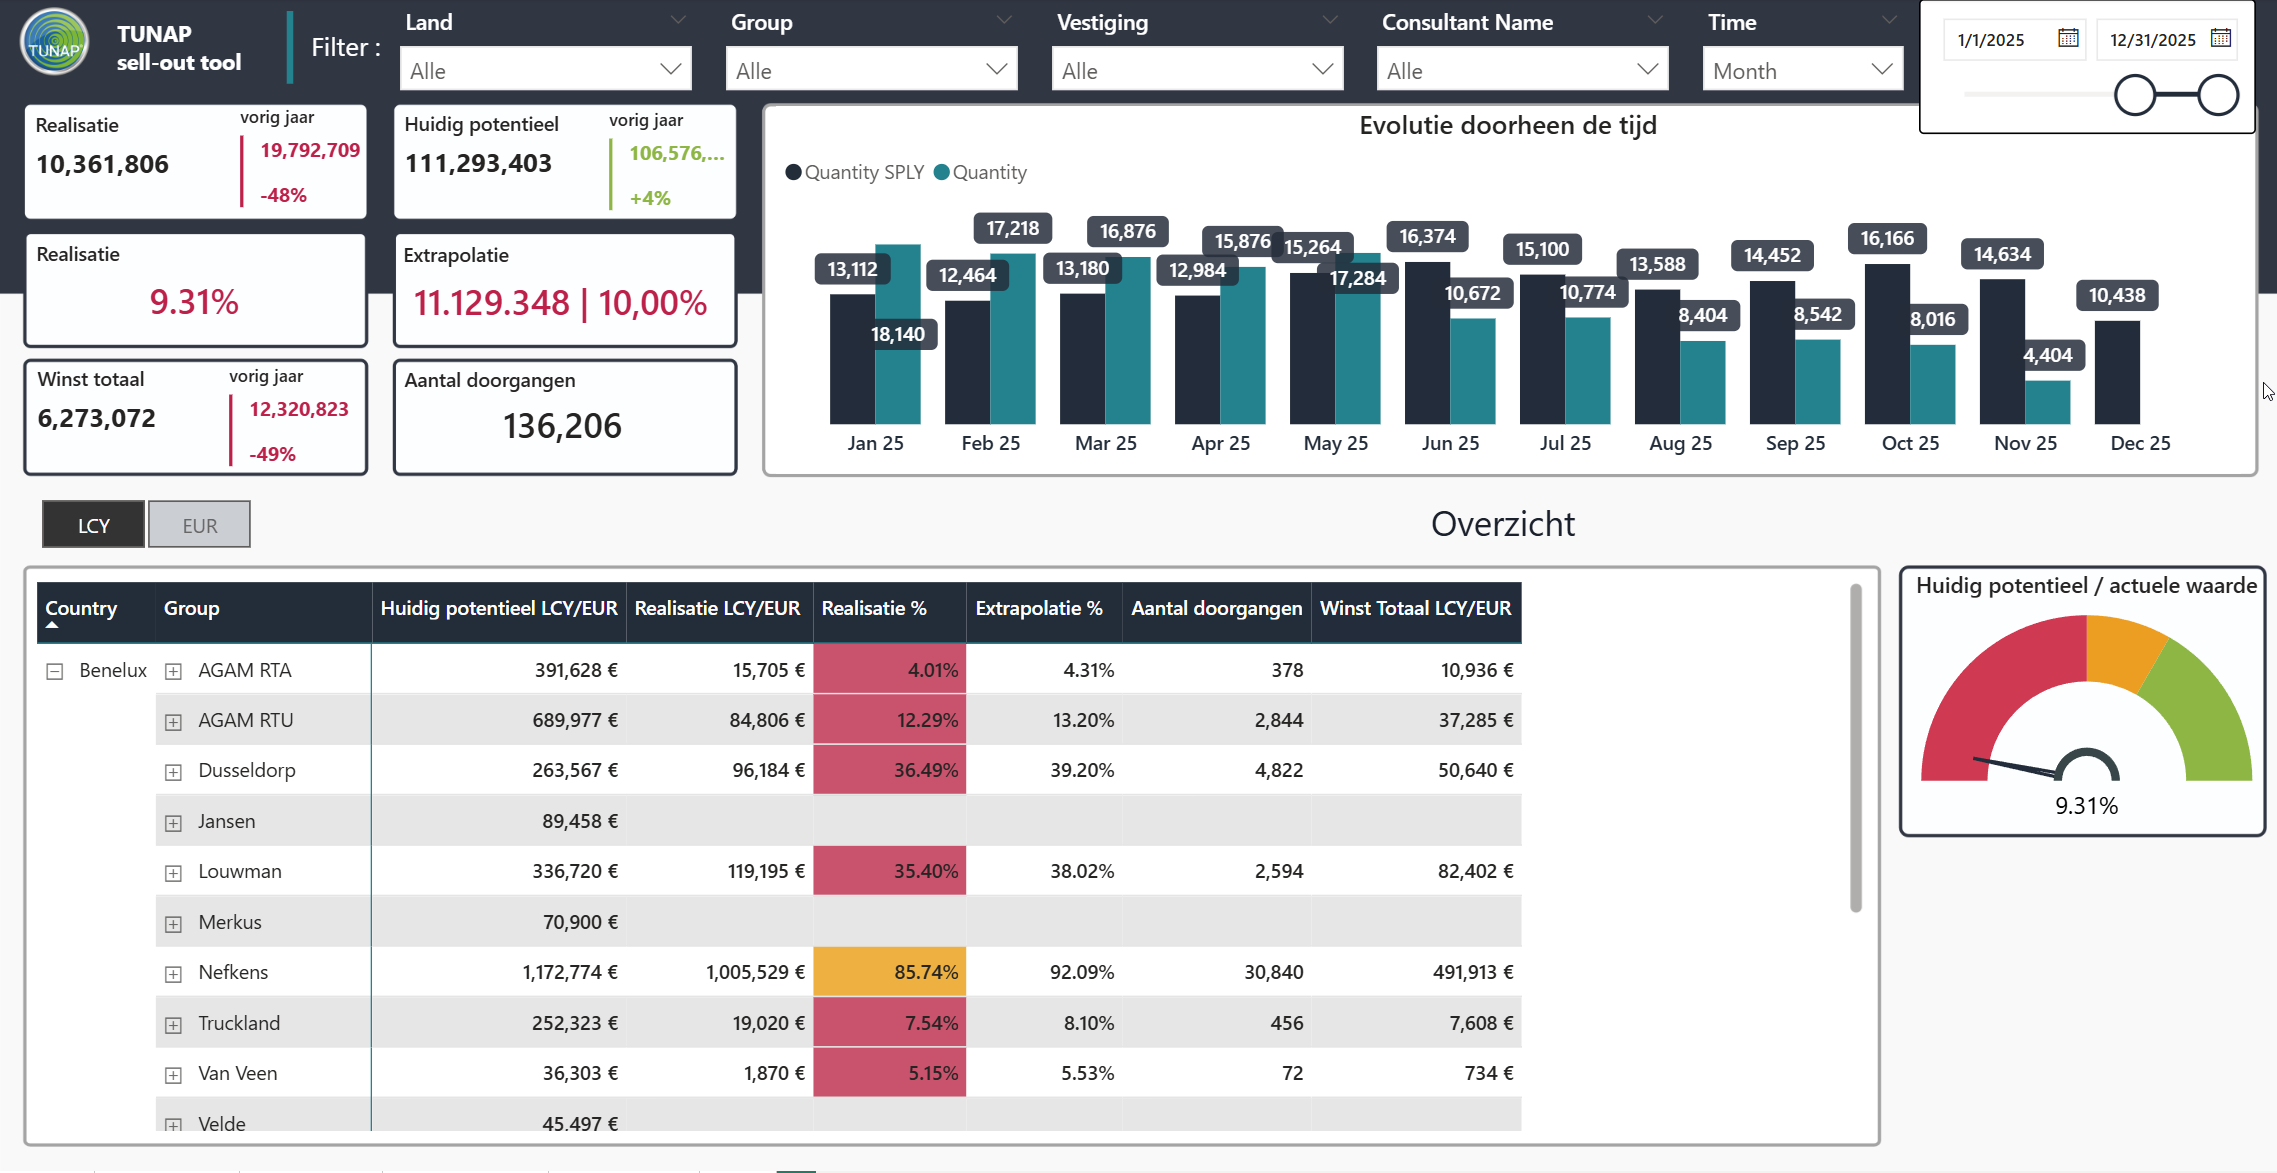
In a nutshell, we built a sell-out tool.
It collects sell-out data from car dealerships and allows sales managers across various countries to analyze the sell-out data and compare it against targets at the dealership, workshop, and consultant levels.
See tun-organization for additional background information.
The solution includes multi-language support and Row Level Security (RLS).
Architecture
Components
All components are installed on the Würth/Tunap tenant.
The following components are part of the solution:
-
Source files in Teams/SharePoint/OneDrive: https://witglobal.sharepoint.com/sites/PowerPartners
-
Power BI: https://app.powerbi.com
Data Sources
The source files are located at: https://witglobal.sharepoint.com/sites/PowerPartners/Freigegebene%20Dokumente/prod/Power%20BI%20v2
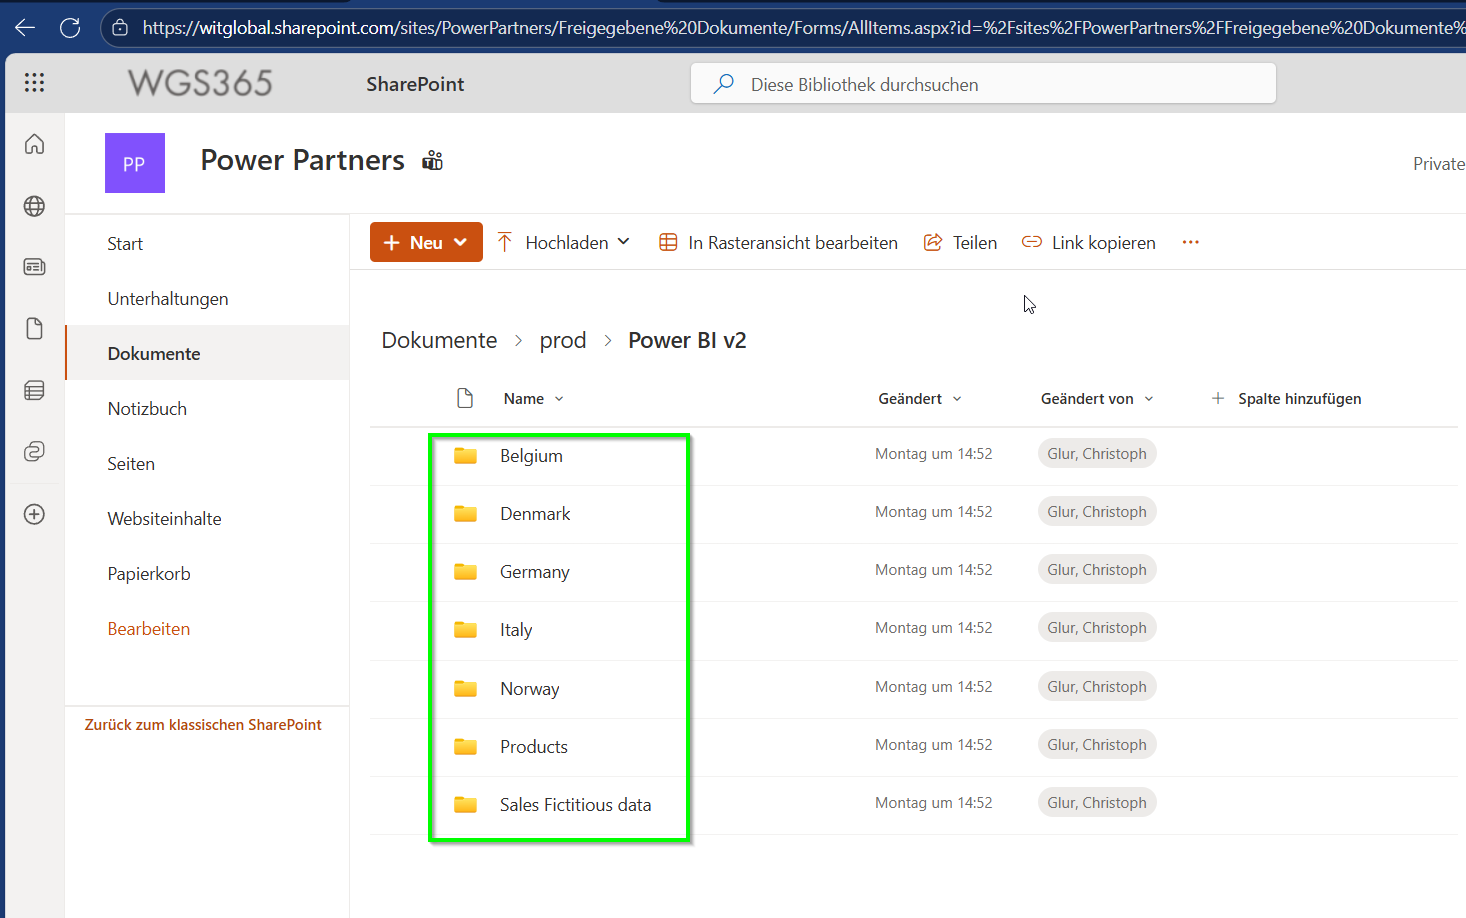
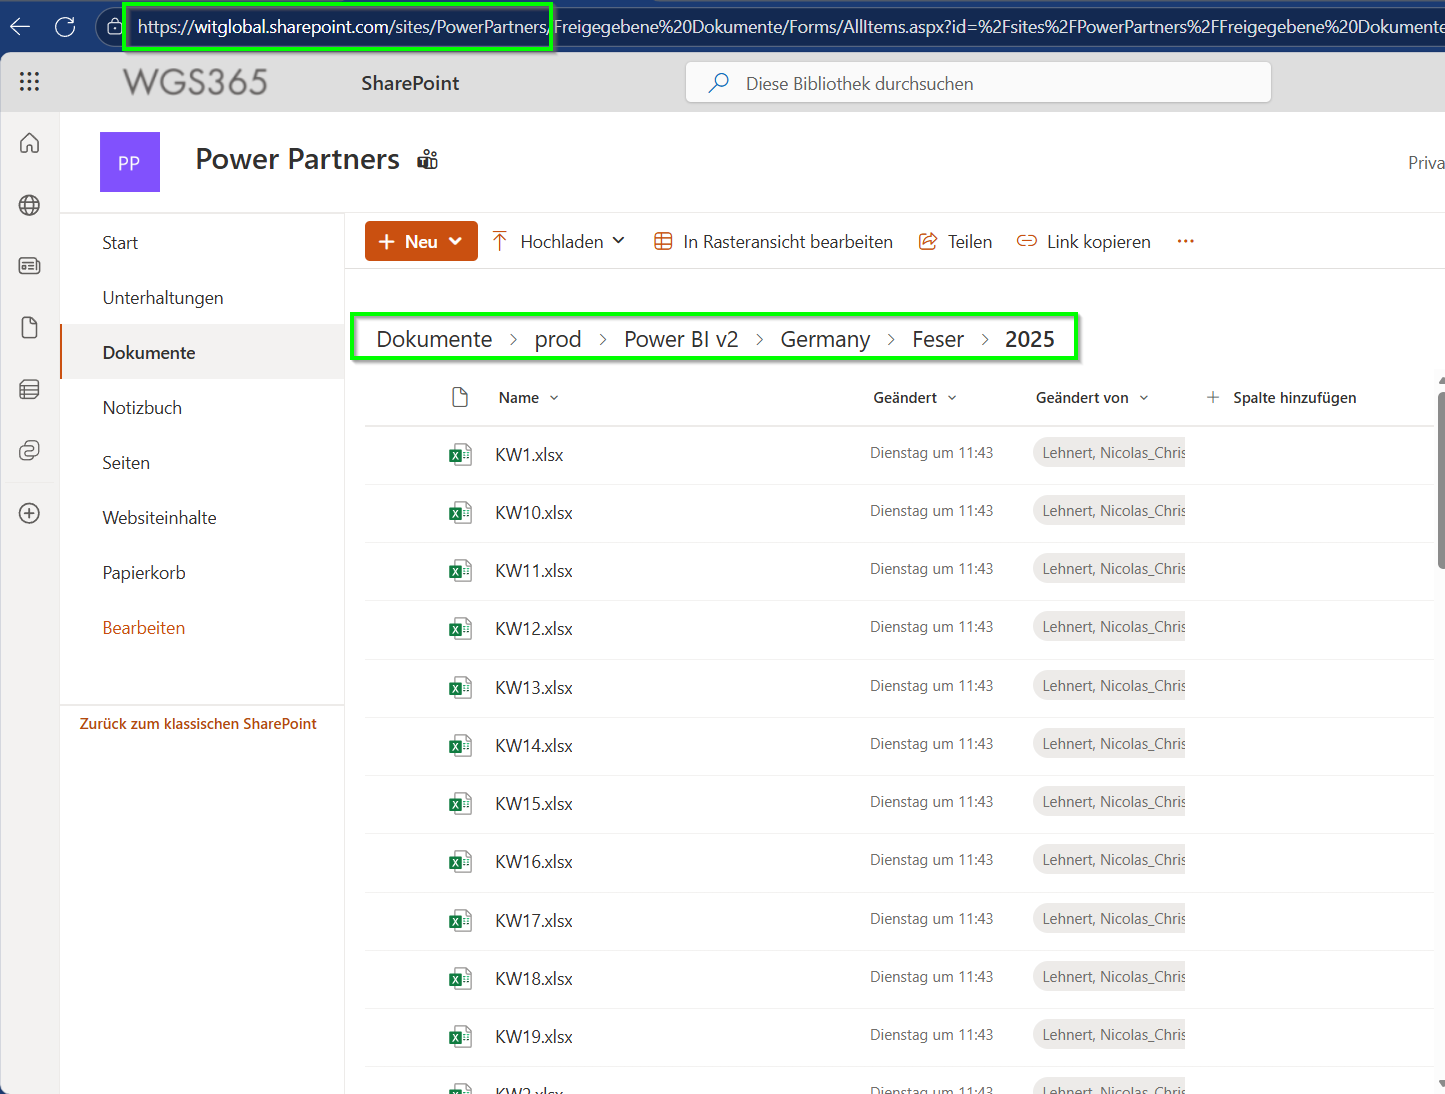
Files are structured by Country/Dealership/Year/Week.
For example:
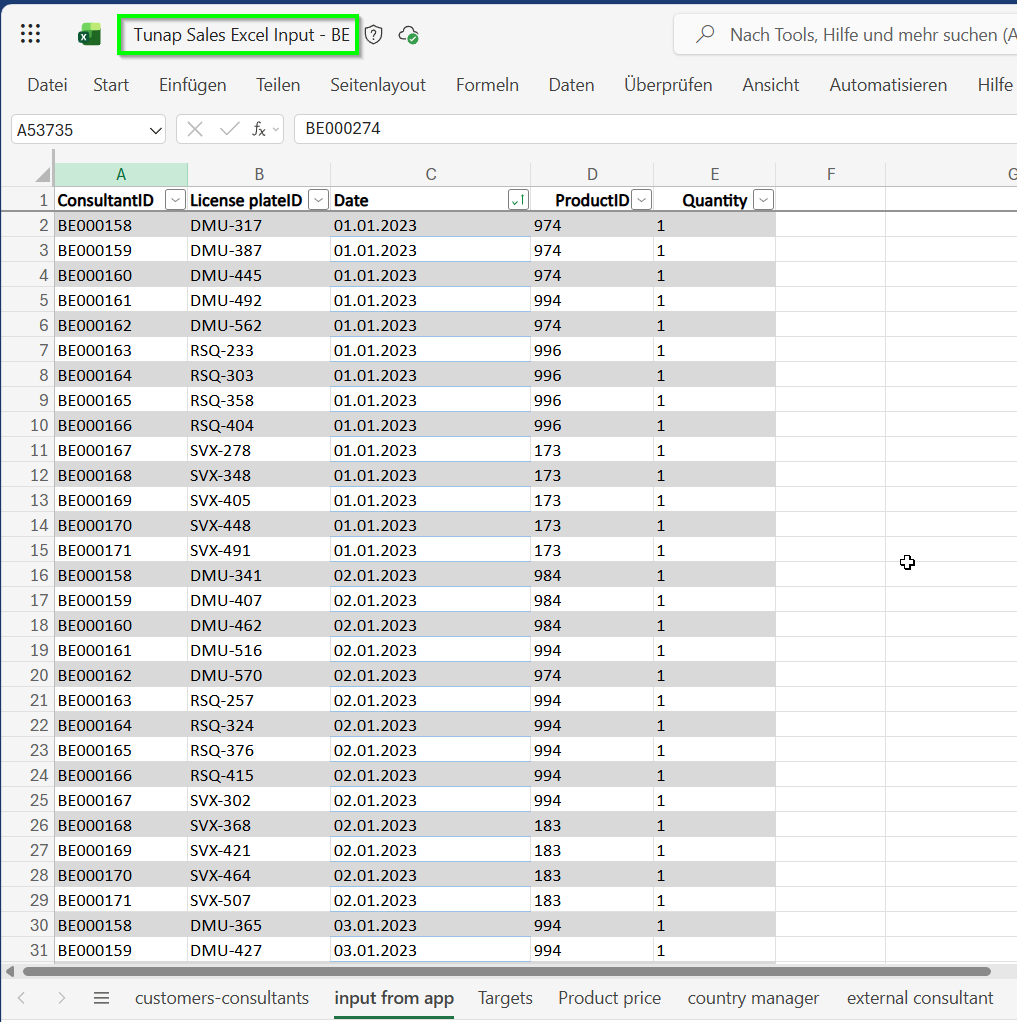
Each dealership uses its own format. A significant part of the solution's value lies in consolidating these disparate formats into a unified structure.
Note that not all files have been migrated. For example, Belgium still uses the Phase 2 standardized translated format, with manual data entry.
Data Lineage
---
config:
  theme: neo
  look: handDrawn
  layout: fixed
---
flowchart TD
 subgraph s7["Web App"]
        n15["Load DE"]
        n16["Load BE"]
  end
 subgraph s1["global cube"]
        n1["Haeusler<br>2025KW17"]
        n9["XYZ<br>2025KW17"]
  end
 subgraph s2["Lueg"]
        n2["Lueg<br>2025KW17"]
  end
 subgraph s3["Input DE"]
        n5["Targets"]
        n10["Product Price"]
        n11["External Consultants"]
        n12["Country Manager"]
  end
 subgraph s4["Input BE"]
        n6["..."]
  end
 subgraph s5["Power BI"]
        n3["global cube<br>dataflow"]
        n4["Lueg<br>dataflow"]
        n7["Sales Report<br>Semantic Model"]
        n8["Sales Report"]
        n13["Data Check Board"]
        n17["Consultant targets<br>without sales"]
        n19["Dealerships<br>without sales, <br>per week"]
        n18["Dealerships<br>Branches<br>Consultants"]
        n20["Input DE<br>dataflow"]
        n21["Input BE<br>dataflow"]
  end
    n1 --> n3
    n2 --> n4
    n7 --> n8 & n13
    n9 --> n3
    n3 --> n7
    n4 --> n7
    s4 --> n21
    n13 --> n17 & n19 & n18
    s3 --> n20
    n20 --> n7
    n21 --> n7
    n15 -.- n4 & n20 & n3
    n15@{ shape: rounded}
    n16@{ shape: rounded}
    n1@{ shape: procs}
    n9@{ shape: procs}
    n2@{ shape: procs}
    n5@{ shape: tag-proc}
    n10@{ shape: tag-proc}
    n11@{ shape: tag-proc}
    n12@{ shape: tag-proc}
    n6@{ shape: tag-proc}
    n3@{ shape: h-cyl}
    n4@{ shape: h-cyl}
    n7@{ shape: db}
    n8@{ shape: div-proc}
    n13@{ shape: div-proc}
    n17@{ shape: proc}
    n19@{ shape: proc}
    n18@{ shape: proc}
    n20@{ shape: h-cyl}
    n21@{ shape: h-cyl}
    style n3 fill:#C8E6C9
    style n4 fill:#C8E6C9
    style n20 fill:#C8E6C9
    style n21 fill:#C8E6C9

    style n13 fill:#FFF9C4
    style n17 fill:#FFF9C4
    style n19 fill:#FFF9C4
    style n18 fill:#FFF9C4
    style s4 fill:#BBDEFB
    style s3 fill:#BBDEFB
    style s1 fill:#FFCDD2
    style s2 fill:#FFCDD2
Entities
| Entity | Source System | Description |
|---|---|---|
| HOLDING | Pre-Defined | Holdings are groups of workshops that operate under the same brand name. Synonyms: Brand, Car Dealership. |
| WORKSHOP | Excel | Each holding has multiple workshops that operate under the same brand. |
| EXTERNAL CONSULTANT | Excel | External consultants are brand representatives who ensure Tunap products are sold. They have targets per workshop. Note: A consultant may represent multiple holdings, and a holding may be represented by multiple consultants. |
| PRODUCT | Excel | The actual products being sold. Each product has a purchase price and a sales price per holding. Price history is maintained. |
| COUNTRY MANAGER | Excel | Each holding is associated with a country or sales region. For example, BE represents Benelux. The country manager is maintained for RLS purposes. |
Workspaces
We have a single Power BI workspace:
| Workspace | Users | Access |
|---|---|---|
| TUNAP sell-out tool | All users of the tool | Users are added to the workspace individually by Würth IT. Users include both Tunap internal staff (e.g., Nicolas_Christof Lehnert) and external users. |
Semantic Models
A table containing all the semantic models.
| Semantic Model | File Name | Workspace |
|---|---|---|
| Sales Report | Sales Report.pbix |
TUNAP sell-out tool |
Reports
A table containing Power BI Reports and Paginated Reports.
| Report | File Name | Key Question | Workspace | Semantic Model |
|---|---|---|---|---|
| Sales Report | Sales Report.pbix |
How did we perform against targets? | TUNAP sell-out tool | Sales Report |
Row Level Security
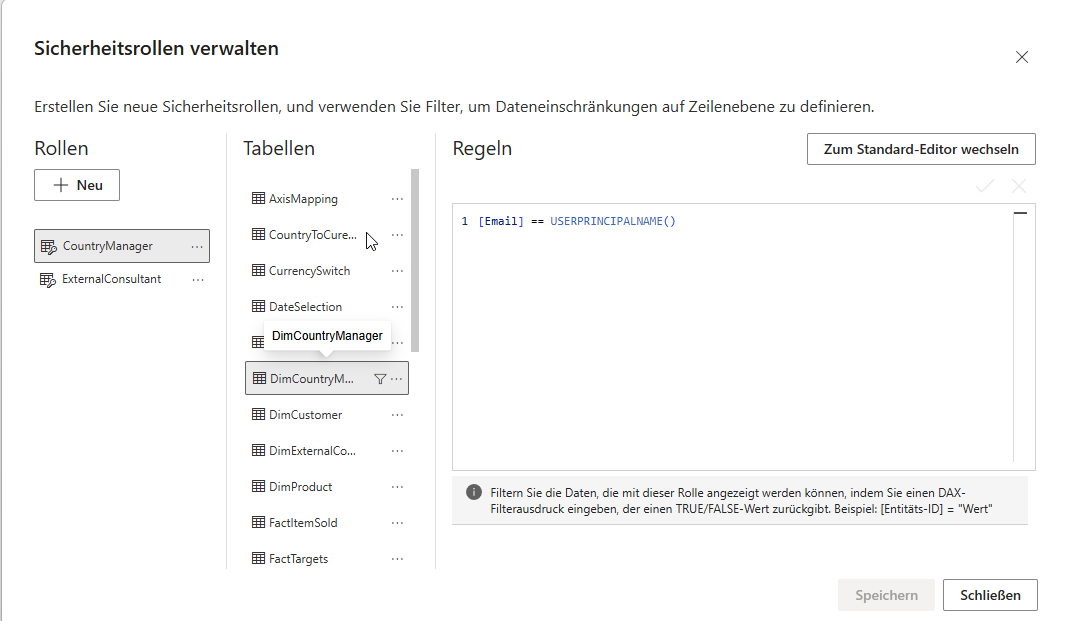
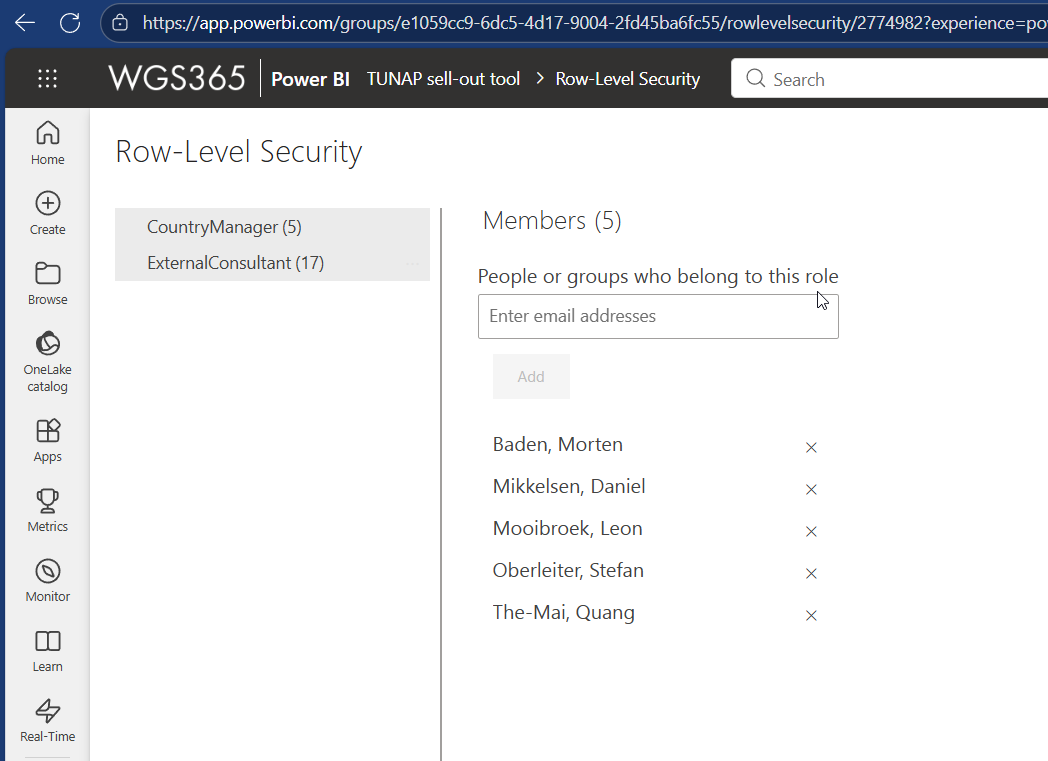
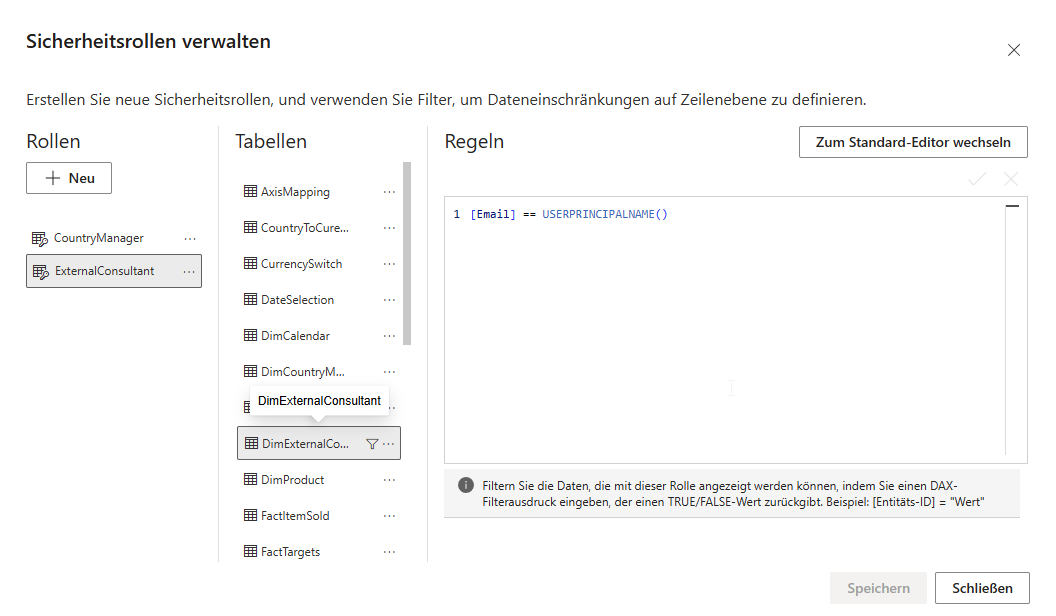
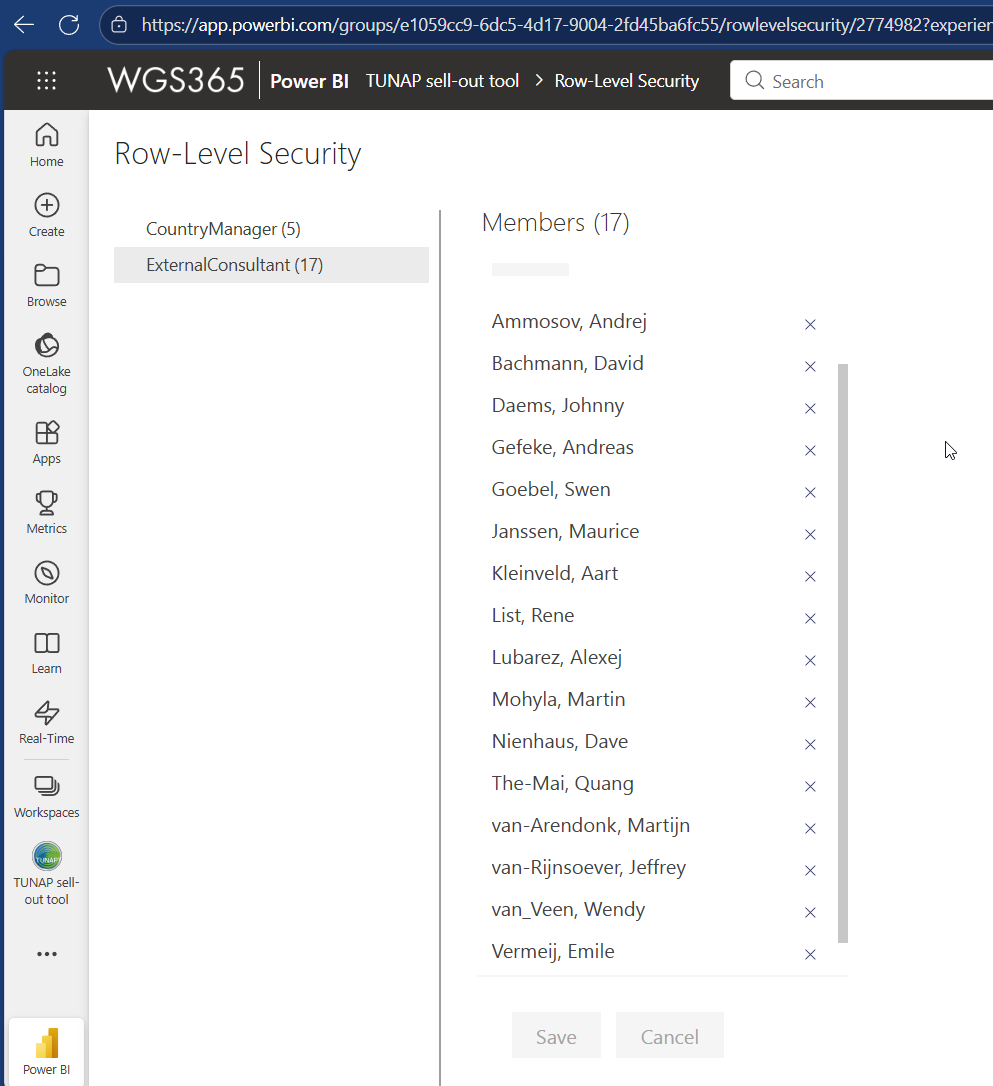
The solution implements Row Level Security (RLS), which restricts data access so that not all users can see all data. Standard Power BI RLS functionality is used.
The following roles are defined:
-
CountryManager
-
ExternalConsultant
Country Manager
Country Managers can see all data for their respective country:
External Consultant
External Consultants can see only their own data:
Multi-Language Support
Standard Power BI multi-language functionality is used.
Changing/Adding Translations
Translations are handled in two ways:
-
Language in data
-
Visual components
Language in Data
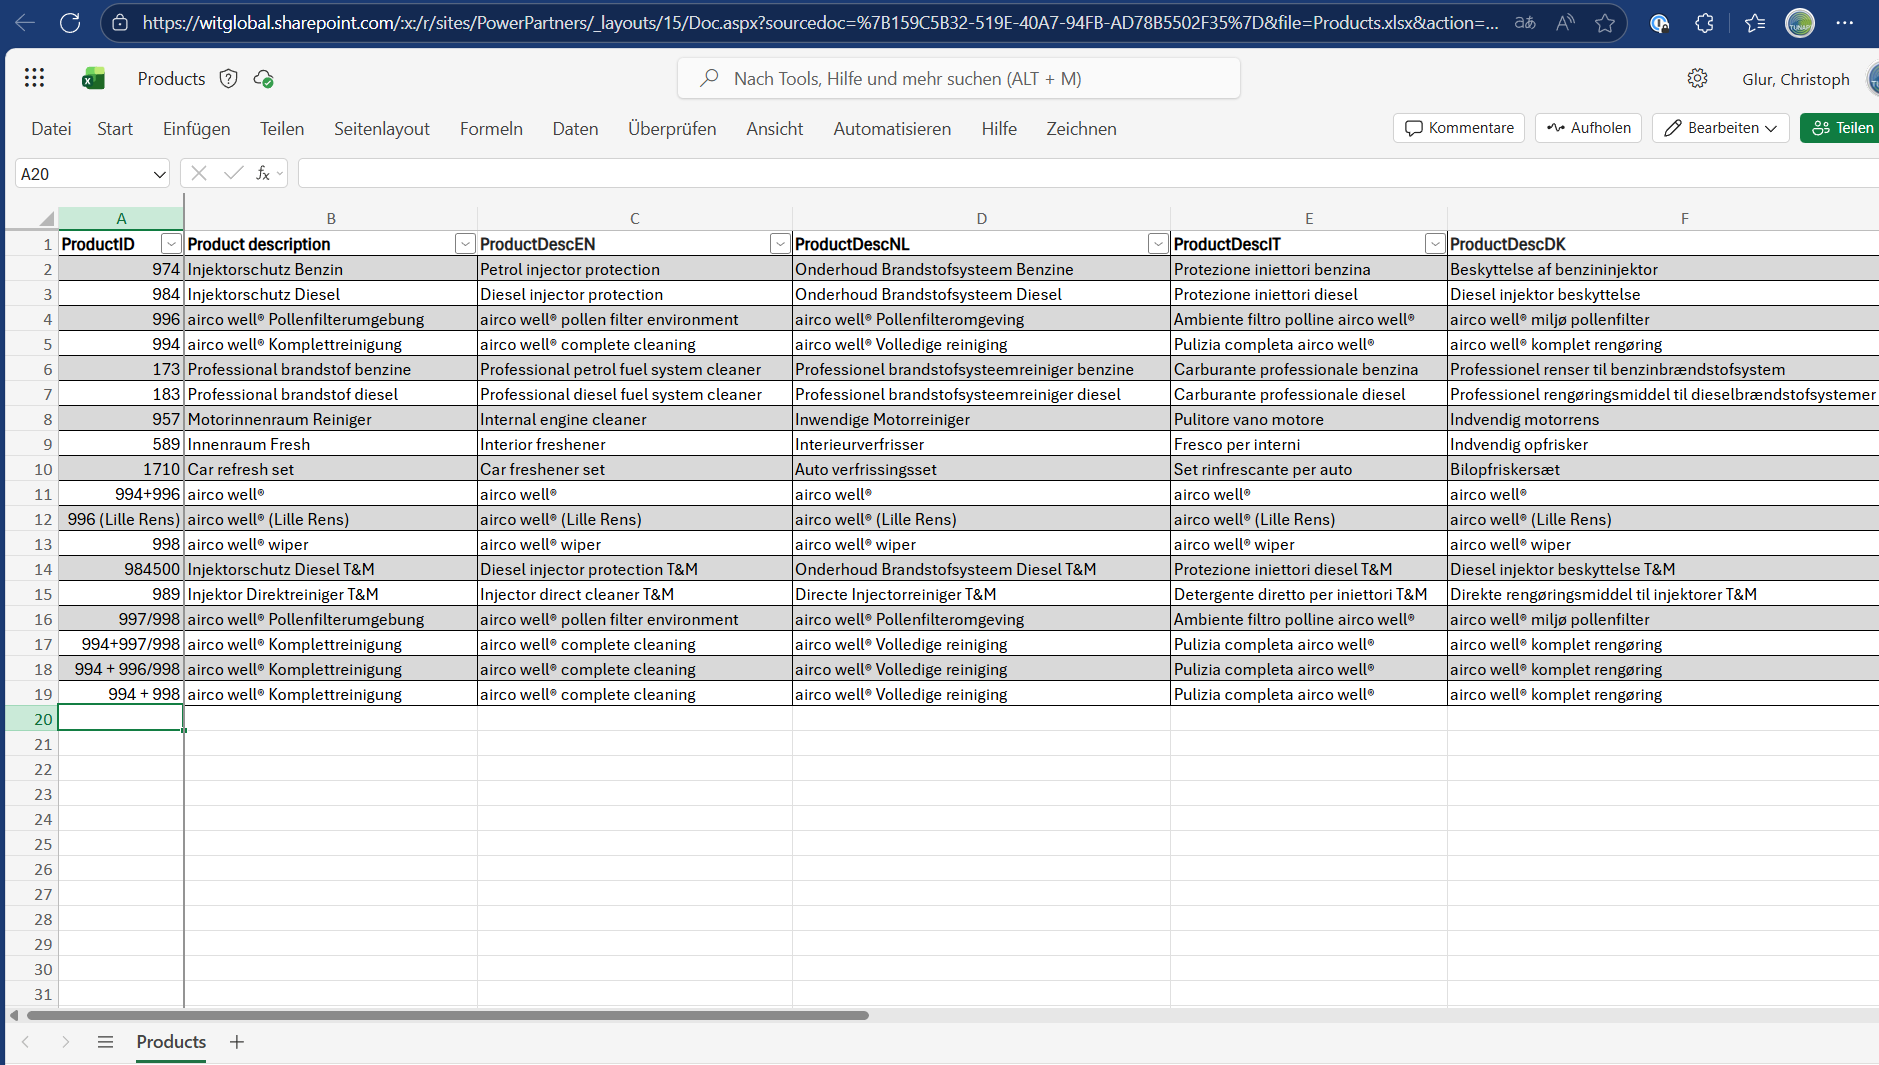
Some translations are defined directly in the source data, such as product translations:
Visual Components
Visual components are translated in Tabular Editor using standard Power BI functionality.