KPI Theory
To define real KPIs, we usually have to put a variable in ratio to another variable.
Formulas are sometimes referred to differently in software packages:
- Excel: Formulas
- Power BI: Measures
- Tableau: Formula / Calculated field
- QlikView: Measures
Ratio
Ratio is the general term to describe a variable that is the result of dividing another variable by yet another one. For example
Quotas, Rates and Margins are all Ratios.
Quota
A quota is a special ratio. A quota is used to express the ratio of a partial quantity to a total quantity.
Quotas are often expressed as a percentage, i.e:
Quotas often refer to stock variables (e.g. women's quota), but sometimes also to flow variables (e.g. personnel expenditure quota).
Important
In common language, quota and rate are often mixed up. This mix-up goes well into generally know KPIs. For example, it is called conversion rate, although it should be conversion quota.
Other examples are Utilization Rate.
Examples of quotas:
Margin
The margin is particularly well known in the retail sector. It is sometimes called price margin, as it often refers to prices. However, it can also refer to aggregated values, such as in the gross margin.
Trade Margin
Gross margin
Markup
The markup is similar the margin, but in relation to the Cost Price:
Rate
We speak of a rate when we relate a flow variable to its corresponding stock variable:
Growth Rate
One of the most common rates is the growth rate:
Return
The return on investment refers to capital investments.
For example, for a project, the return is:
Yield
For financial investments with fixed returns (such as a bond), the return is called yield:
Profitability
Warning
Profitability and return are often equated in common parlance. There is also no scientific definition, and different authors use the terms differently. This is how we see it:
- yield refers to interest paid on fixed-rate financial investments. It is a rate, e.g. the interest rate.
- profitability refers to the company's success, for example in relation to capital or turnover.
Return on Equity
Where:
- ROE: Return on Equity
- E: Earnings
- S: Stock (= Equity)
Return on Sales
Efficiency
How much energy do you need on average to produce a shoe? How many euros do you have to spend before a new customer signs a contract? These are examples of efficiency. The fewer inputs you need to generate one unit of output, the greater your efficiency.
where the units (x, y) of the Output and the Input are different.
Car Efficiency
In the USA, the efficiency of motor vehicles is stated as follows:
Note
In Europe, we do not typically use car efficiency. Instead, we typically use the effort coefficient (\(\frac{\mathrm{l}}{100\,\mathrm{km}}\)), as you will see in a moment.
Marketing Efficiency
Sales Efficiency
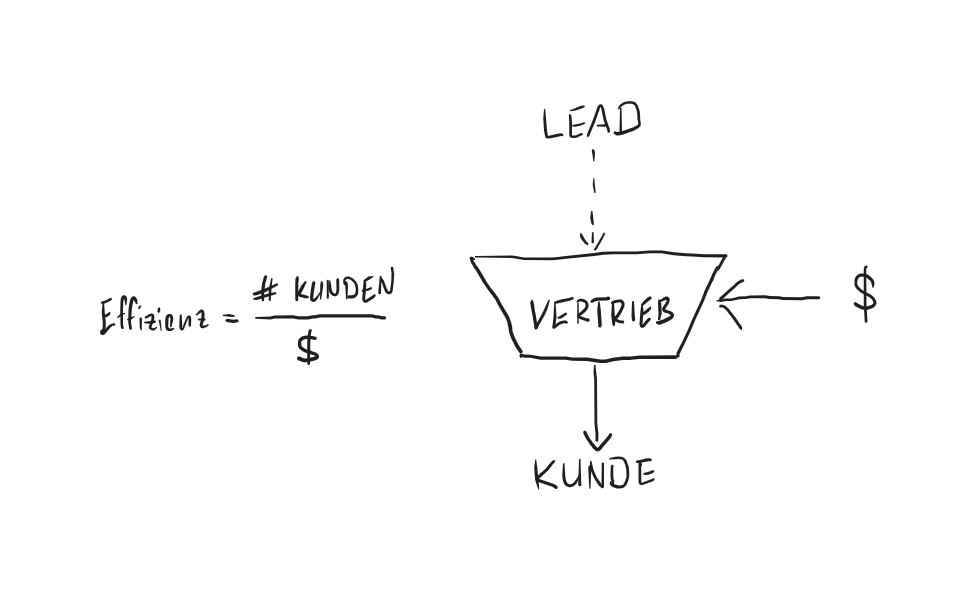
Sales Agent Efficiency
Effort coefficient
The effort coefficient is the reciprocal of the efficiency.
Car Effort Coefficient
In Europe, the cost coefficient is usually specified, and not the efficiency, as is the case with cars, for example:
Recruitment Effort Coefficient
Conversion Efficiency (Wirkungsgrad)
Note
Efficiency and effectiveness are not the same thing. With efficiency, I can compare apples with oranges, but not with effectiveness: here, the unit of input is equal to the unit of output. So I measure how many inputs are lost in my "machine".
This is also known in management, where efficiency and effectiveness are sometimes highlighted:
- Effectiveness: Am I doing the right thing?
- Efficiency: Am I doing things right?
But Efficiency and Conversion Efficiency (in German: Wirkungsgrad) and Efficiency are also different!
Conversion Efficiency answers the question: How much output can be generated with a certain amount of input?
In contrast to efficiency, the unit of input and output is the same.
Technically speaking, efficiency is a Quota. But in business language, they are often (wrongly) referred to as rate, as you'll see below.
The origin of Conversion Efficiency is the engineering sector, where, for example, the percentage of energy put into a motor that is actually converted into kinetic energy (versus thermal energy) is measured.
In business intelligence, efficiency is mainly used for funnels.
Hire Rate
Sales Rate
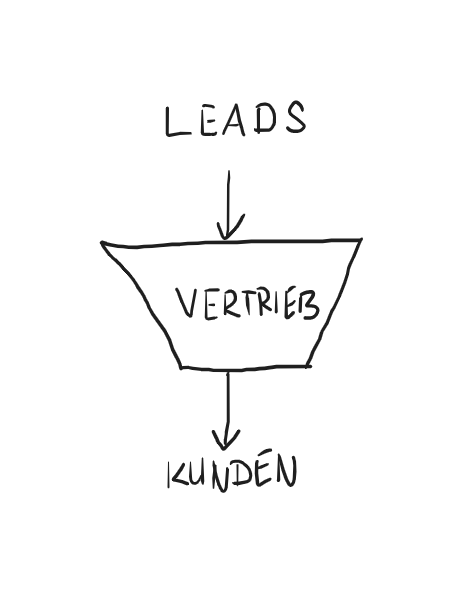
Conversion Rate
Turnover Rate
The turnover rate is the rate at which a stock variable is renewed.
Imagine Scrooge McDuck's money bin again. The stock is 100 zillion dimes. And one zillion dimes goes out every day. Each day, \(\frac{1}{100}\) of his dimes are turned over.
Inventory Turnover Rate
The same principle is often applied to inventory management.
If the inventory turns are calculated for a single product, the numerator and denominator can be calculated in number of units, i.e:
But normally a warehouse consists of different products or components, so we use the monetary value as the unit:
The turnover rate is unitless: The unit of the denominator corresponds to that of the numerator and is truncated.
The Inventory Turnover Rate sounds easy, but it is complicated. We have to value the products or components regularly, because the price can change during the storage period. Various calculation methods are used, such as
- Calculation at cost price
- Calculation at sales prices
- FIFO (First in First Out)
- LIFO (Last in First Out)
- etc.
Staff Turnover
Staff turnover indicates how stable our workforce is:
Total Asset Turnover
Total Asset Turnover (TAT) indicates how large our balance sheet is compared to sales. A high total asset turnover indicates that our company is running hot.
Where:
-
TAT: Total Asset Turnover
-
A: Assets
Dwell Time
The dwell time is the reciprocal of the turnover rate:
To stay with our image of Scrooge's money store: With a turnover rate of \(\frac{1}{100}\), a dime remains in the money store for an average of 100 days. And: If nothing came in, it would take exactly one hundred days for the store to be empty.
As you can see: The dwell period is also a measure of risk that indicates how great the danger is that our stock (warehouse, account, employees etc.) is exhausted.
Employee Length of Stay
The length of stay, in years, is:
$$
\varnothing LengthOfStay = \frac{1}{StaffTurnover}=\frac{\varnothing {# Employees}}{ {# Leavers} \text{p.a.}}
$$
Days In Inventory
This is the reciprocal of the Inventory Turnover Rate:
Where:
- DII: Days In Stock
- COGS: Cost of Goods Sold