Components
---

config:

  theme: redux

---

flowchart TD

 subgraph s1["alkitornic on-prem"]

        n1["Sage<br>"]

        n3["Datev"]

        n4["Power BI<br>Gateway"]

        n5["File Export"]

  end

 subgraph s2["Power BI Service"]

        n2["Dataflows"]

        n6["Semantic Models"]

        n7["Reports"]

  end

 subgraph s3["M365"]

        n8["SharePoint"]

  end

    n1 --> n4

    n4 --> n2

    n3 --> n5

    n5 --> n4

    n2 --> n6

    n6 --> n7

    n8 --> n2

    n1@{ shape: rect}

    n3@{ shape: rect}

    n4@{ shape: rect}

    n5@{ shape: rect}

    n6@{ shape: rect}

    n7@{ shape: rect}
Workspaces
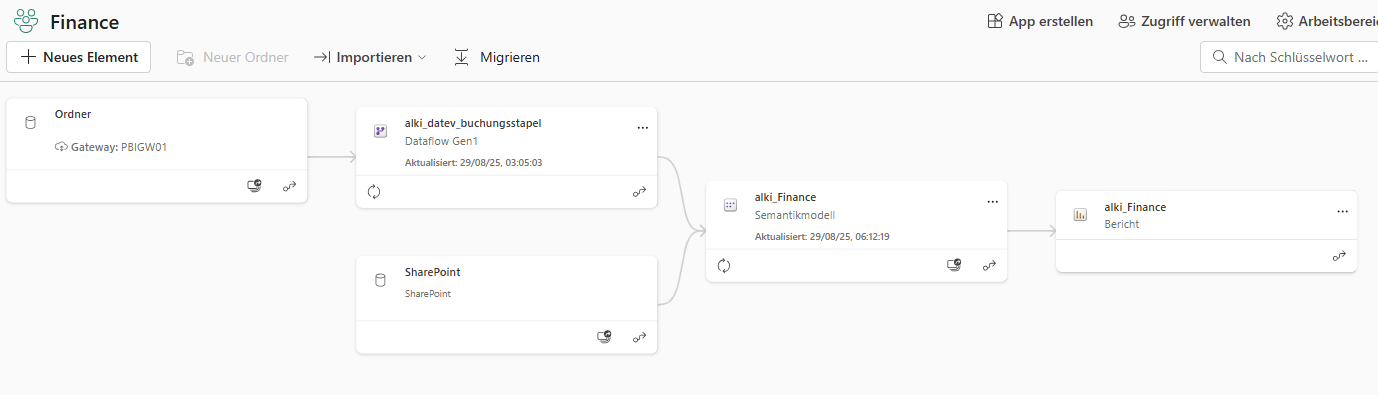
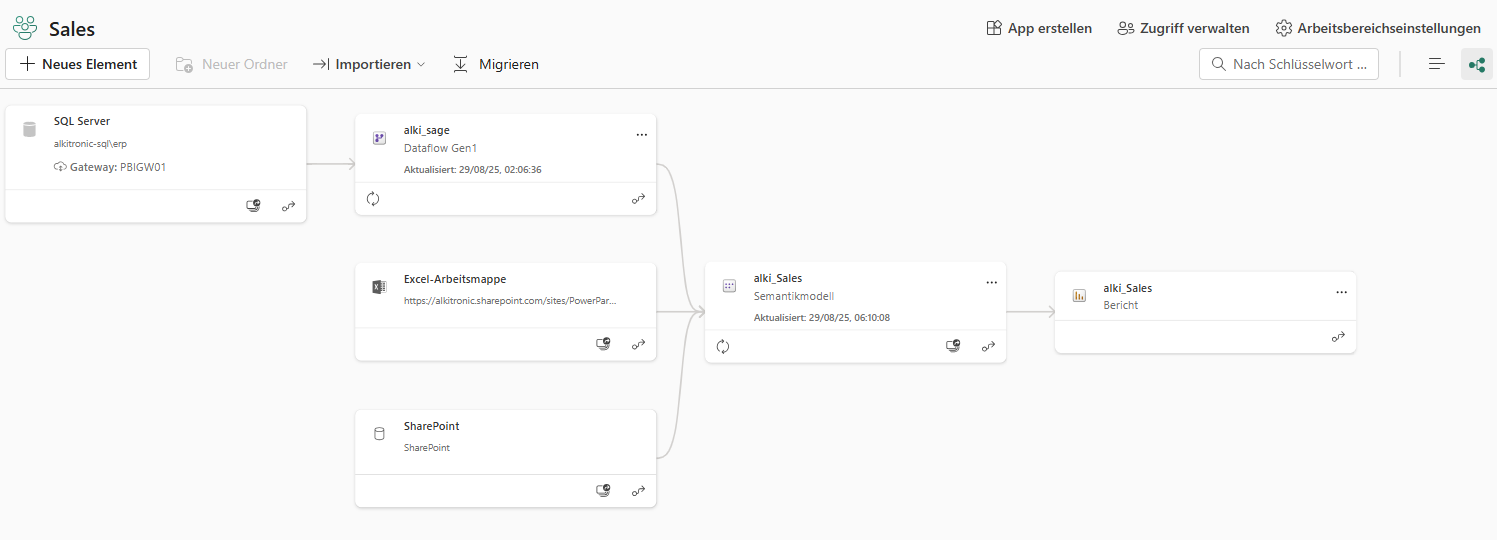
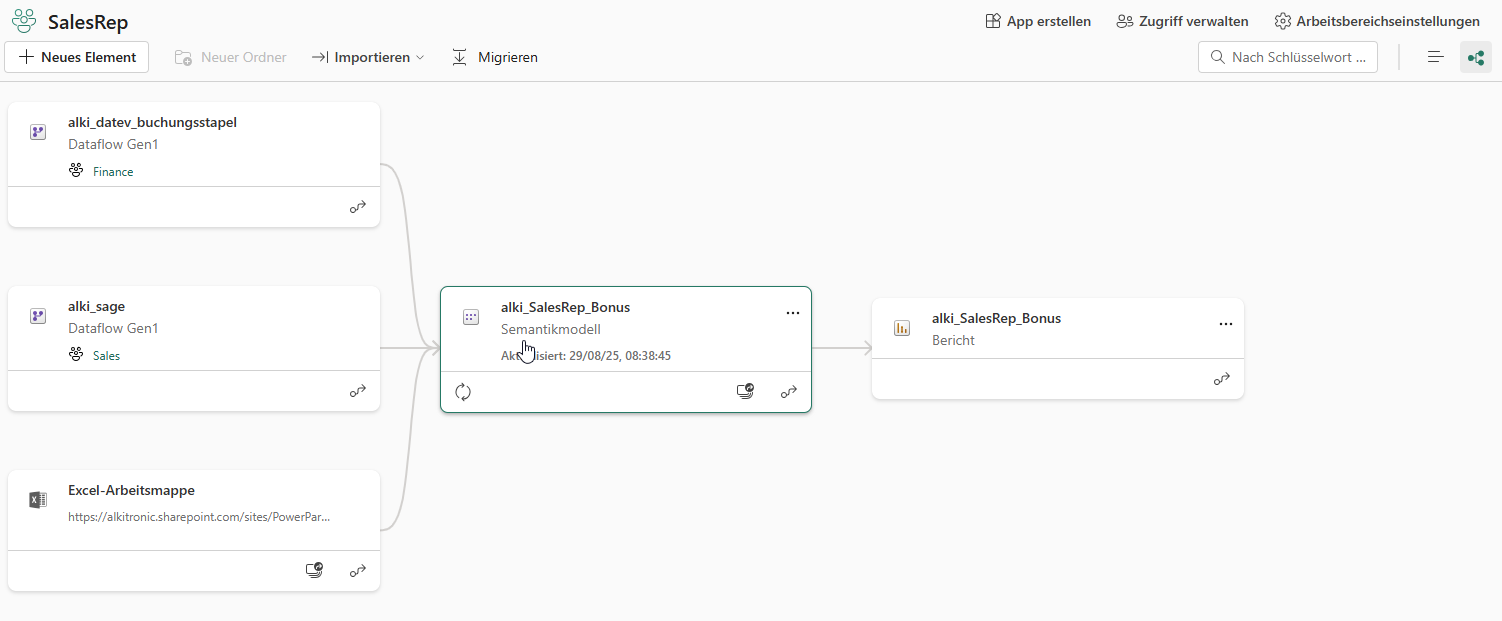
In Power BI Service, we have the following workspaces:
-
Finance
-
Sales
-
SalesRep
Lineage