Key Measures
Switch
There are several measures used within the BC_finance_dataset file however within this section only the more advanced measures are covered.
The main focus within the Finance Reporting Accelerator is to represent the P&L positions of the business user in the correct way within a matrix visual.
Since this data is coming from the General Ledger the structure of the Fact table is such that there is a GLAccountNoID column that is used to connect the FactGLAmount table to the DimAccount. The next connecting instance is between the DimAccount and P&L Structure table. The P&L Structure table is located outside of BC, stored in the clients SharePoint (Teams) location within an excel file. The structure of this P&L Structure file is specific to each client but the columns should remain consistent, so the steps in Power Query and the DAX measures within the pbix file can remain automatically updated when switching the source.
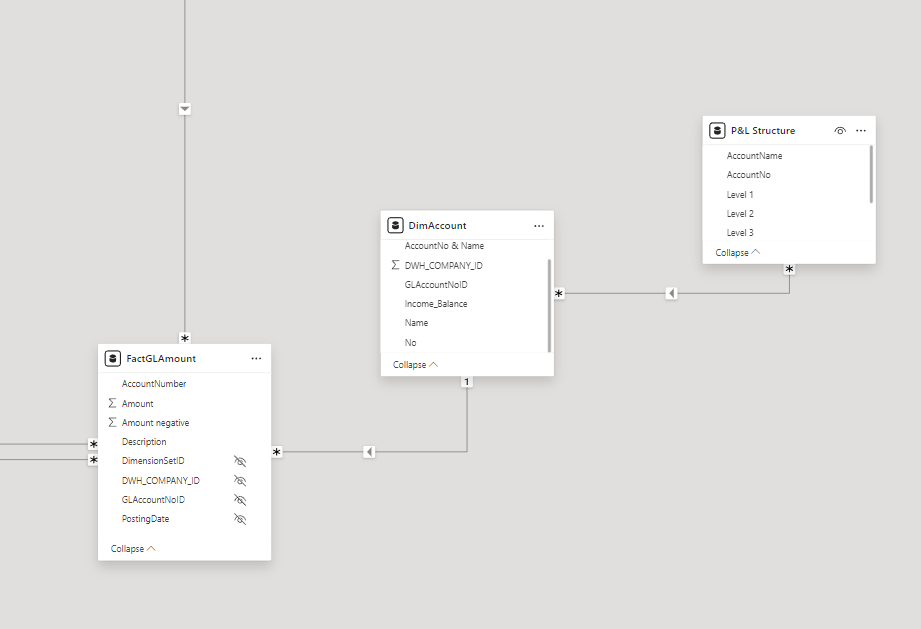
By linking the account number of the P&L structure file to the DimAccount table we can later achieve the correct summation by each P&L level, utilizing the SWITCH function.
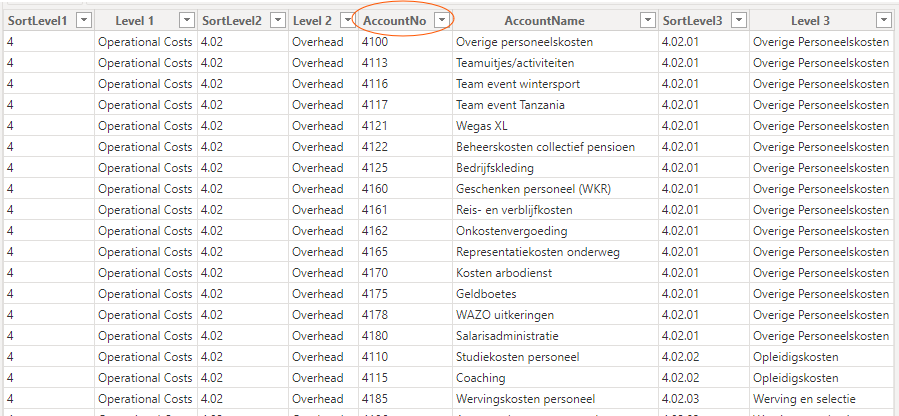
The P&L Structure file contains several necessary columns that are mandatory for the SWITCH function to work, as well for the proper sorting of the matrix that will hold the P&L values:
The base measure is the Som Amount that summarizes all rows within the Amount column:
The next step is the SWITCH measure that is used to display the correct values in the report within a matrix:
Switch P&L =

SWITCH(

       SELECTEDVALUE('P&L Structure'[Level 1]),

        "Turnover", [Som Amount neg],

        "Cost of Goods Sold", [Som Amount neg],

        "Total Gross Margin", CALCULATE([Gross Margin],

                               ALL('P&L Structure'))
        )
To elaborate on what happens in the code above. In the matrix we want to show values from the FactGLAmount assigned to the relevant levels within the P&L structure provided by the client (as within BC we do not have the P&L structure defined).
In order to achieve this we combine BC tables with the mapping excel table.
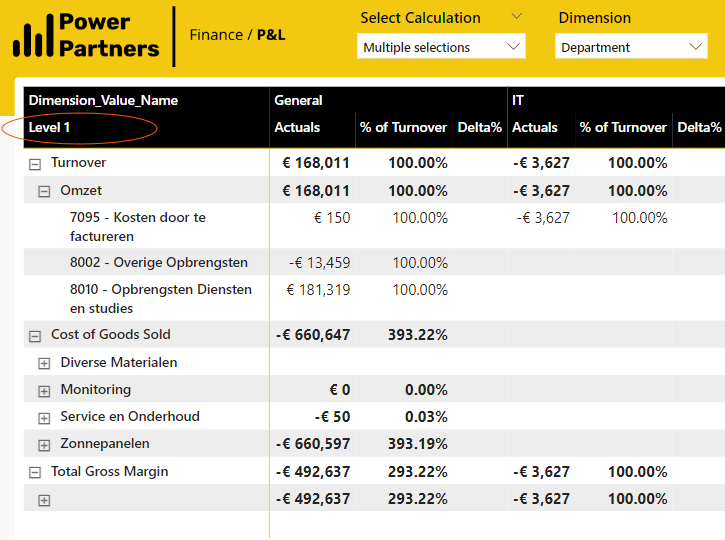
For this matrix we have used the Level 1 and Level 2 from the P&L Structure table and the AccountNo & Name from the DimAccount table.
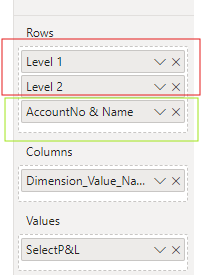
So if we revisit the DAX code of this SWITCH function what it does is:
-
checks the name of the Level 1 row in the current matrix row context with the SELECTEDVALUE('P&L Structure'[Level 1])
-
Returns the sum of all values that correspond to the Level 1 name, depending if it's Turnover, Cost of Gods Sold, etc. by taking the AccountNo from the P&L Structure table and finding the values assigned to those AccountNo within the FactGLTable, through the intermediary DimAccount table.

When it comes to the Total Gross Margin we notice that the code is different, as it references a Gross Margin measure within a CALCULATE statement that uses the ALL function to remove filters from the P&L Structure table:
The Gross Margin is calculated by summing the previous 2 levels of the matrix:
Gross Margin = [Turnover] + [COGS - Direct Costs]

where e.g. :

Turnover = CALCULATE([Som Amount neg], 'P&L Structure'[Level 1] = "Turnover")
The reason why we are including ALL for the calculation of Gross Margin is because Gross Margin doesn't have directly any account numbers assigned to it, but consists of the difference between summing the amounts associated to account numbers that belong to Turnover and Cost of Goods Sold.

If we just reference the same code to Gross Margin as for Turnover and COGS ([Som Amount neg]) we would get a BLANK output, as there are no account numbers that can be matched between P&L Structure, DimAccount, and FactGLTable.
So in order to implement the correct SWITCH function all Level 1 references that have AccountNo assigned can use the [Som Amount neg] while all Level 1 references without an AccountNo need to reference their measures wrapped in a CALCULATE statement including the ALL filter function.
PERIOD-OVER-PERIOD
In order to show values over periods there is a DAX formula used to dynamically switch between different period calculation based on the selected period (month-quarter-year).
This gives the resulting measure on a year-over-year (YOY), quarter-over-quarter (QOQ) or month-over-month (MOM) basis.
To produce this result a period-over-period (PoP) calculation is used:
Measure PoP% Gross Margin =


VAR __PREV_QUARTER = CALCULATE([Gross Margin], DATEADD(DimCalendar[Date], -1, QUARTER))

VAR __QOQ = DIVIDE([Gross Margin] - __PREV_QUARTER, __PREV_QUARTER)

VAR __PREV_MONTH = CALCULATE([Gross Margin], DATEADD(DimCalendar[Date], -1, MONTH))

VAR __MOM = DIVIDE([Gross Margin] - __PREV_MONTH, __PREV_MONTH)

VAR __PREV_YEAR = CALCULATE([Gross Margin], DATEADD(DimCalendar[Date], -1 , YEAR))

VAR __YOY = DIVIDE([Gross Margin] - __PREV_YEAR, __PREV_YEAR)


RETURN

    SWITCH(TRUE(),

        HASONEFILTER(DimCalendar[Year Month Number]), __MOM,

        HASONEFILTER(DimCalendar[Year Quarter]), __QOQ,

        HASONEFILTER(DimCalendar[Year]), __YOY,

        BLANK()

    )
The variable Previous Quarter is used to calculate the value of the Gross Margin one quarter before the quarter in the current date context of the visual.
The variable QOQ calculates the relative difference between the current Gross Margin value compared to the previous quarter.
The variable Previous Month is used to calculate the value of the Gross Margin one month before the month in the current date context of the visual.
The variable MOM calculates the relative difference between the current Gross Margin value compared to the previous month.
The variable Previous Year is used to calculate the value of the Gross Margin one year before the year in the current date context of the visual.
The variable YOY calculates the relative difference between the current Gross Margin value compared to the previous year.
In order for the PoP calculation to work it has to be combined with a specific field parameter date slicer:
SelectDate = {

    ("Year", NAMEOF('DimCalendar'[Year]), 0),

    ("Quarter", NAMEOF('DimCalendar'[Year Quarter]), 1),

    ("Month", NAMEOF('DimCalendar'[Year Month Number]), 2)

}
These 3 columns from the DimCalendar table are the ones reffered to in the PoP DAX code.
% OF TOTAL
If within the P&L matrix we want to show how much each P&L level evaluates to, as a % of a specific measure e.g. % of total turnover, we use the following code:
Switch P&L % total Turnover =

VAR SumTotalRevenue = CALCULATE([Turnover], ALL('P&L Structure'))

RETURN

SWITCH(

       SELECTEDVALUE('P&L Structure'[Level 1]),

        "Turnover", ABS( DIVIDE([Som Amount neg], SumTotalRevenue)),


        "Cost of Goods Sold", ABS( DIVIDE([Som Amount neg], SumTotalRevenue)),


        "Total Gross Margin", ABS( DIVIDE(CALCULATE([Gross Margin],

                                        ALL('P&L Structure')), SumTotalRevenue))
   )
The variable SumTotalRevenue returns on each reporting level the value for the turnover while within the SWITCH function we divide each reporting level with this total turnover value. This gives us the following output:
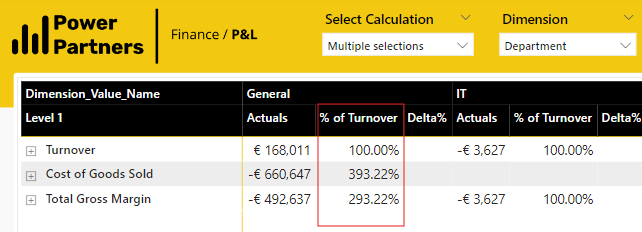
Of course total turnover divided by itself gives us 100% while other KPIs produce different results.
Low COGS Percentage is generally better, as it indicates higher gross margins and better profitability.
High Gross Margin Percentage: Indicates strong profitability, efficient operations, effective pricing strategies, and competitive advantage.