Analyst Case Interview - Interviewer Background
Case
Mayfair Real Estate is a real estate agent with 10 employees. They sell around 120 houses per year on behalf of their clients.
The business process of Mayfair is like this:
-
For a new property to be sold, the agent puts pictures and information of the property into RealSoft, their real estate ERP.
-
RealSoft has a feature to list the property on Mayfair website at the click of a button.
-
The agent then plans one or more paid facebook campaigns, in which he adds nice pictures and a link to the web site listing.
The manager of Mayfair would like to analyse how impactful the facebook campaigns are. The success of a campaign is measured by the number of site views of a property on Mayfair website.
Guidance
-
Be nice to the candidate.
-
The setting is artificial. Don't overdo it with the role play. But also make it clear that the candidate is the driver of the process.
-
1 hour is short. Don't spend too much time on a single topic. If the candidate gets stuck, help him and move on.
Levels of Data Analysis
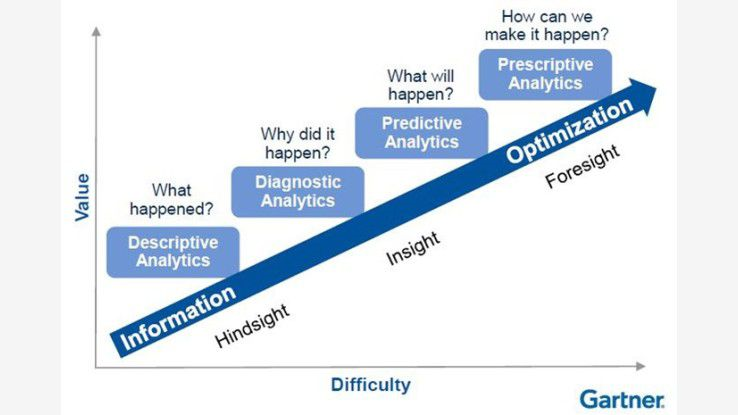
For this case, we will be mostly with "Descriptive Analytics" and "Diagnostic Analytics".
ADM (Semantic Data Model)
This is called "Constellation Diagram" in the DAMA-DMBOK.
See https://www.amazon.com/DAMA-DMBOK-Data-Management-Body-Knowledge/dp/1634622340 for details.
erDiagram

    FactViews {
        int Biews
    }

    FactCampaign {
        ccy Budget
    }


    DimCalendar {
        date Date
        etc etc
    }

    DimProperty {
        txt Type
        txt Segment
        txt City
        txt Agent
    }


    DimCalendar ||--o{ FactViews: refs
    DimCalendar ||--o{ FactCampaign: refs
    DimProperty ||--o{ FactViews: refs
    DimProperty ||--o{ FactCampaign: refs
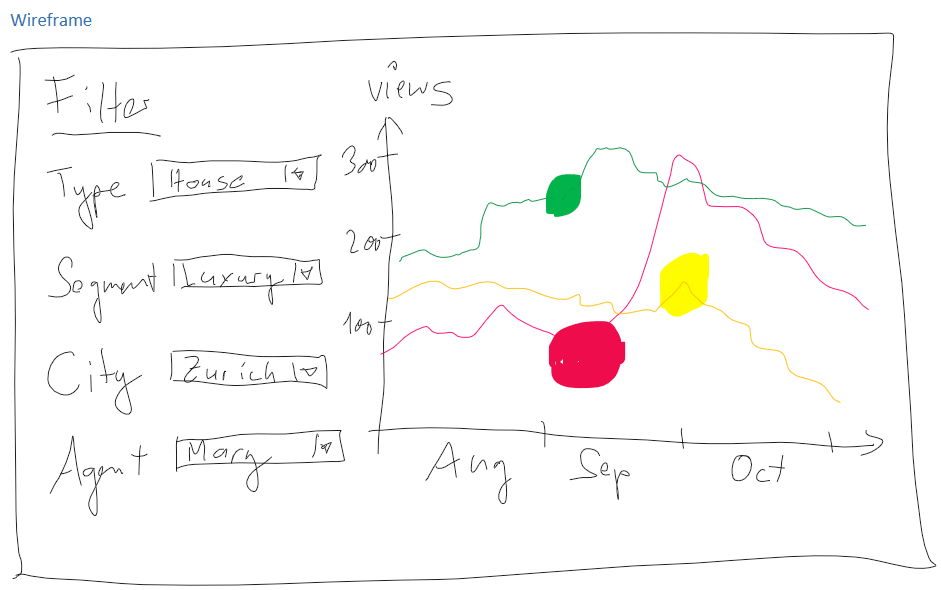
Wireframe
This is probably the worst possible wireframe. But it's our wireframe. :-)